# Set Up Field Health Monitors

{% hint style="info" %}
On-Demand Monitors are **not applicable** for the "Cardinality" test type.
{% endhint %}

**Enabling Field Health Monitoring**

To enable field health monitoring:

1. Navigate to the **Config** landing page.
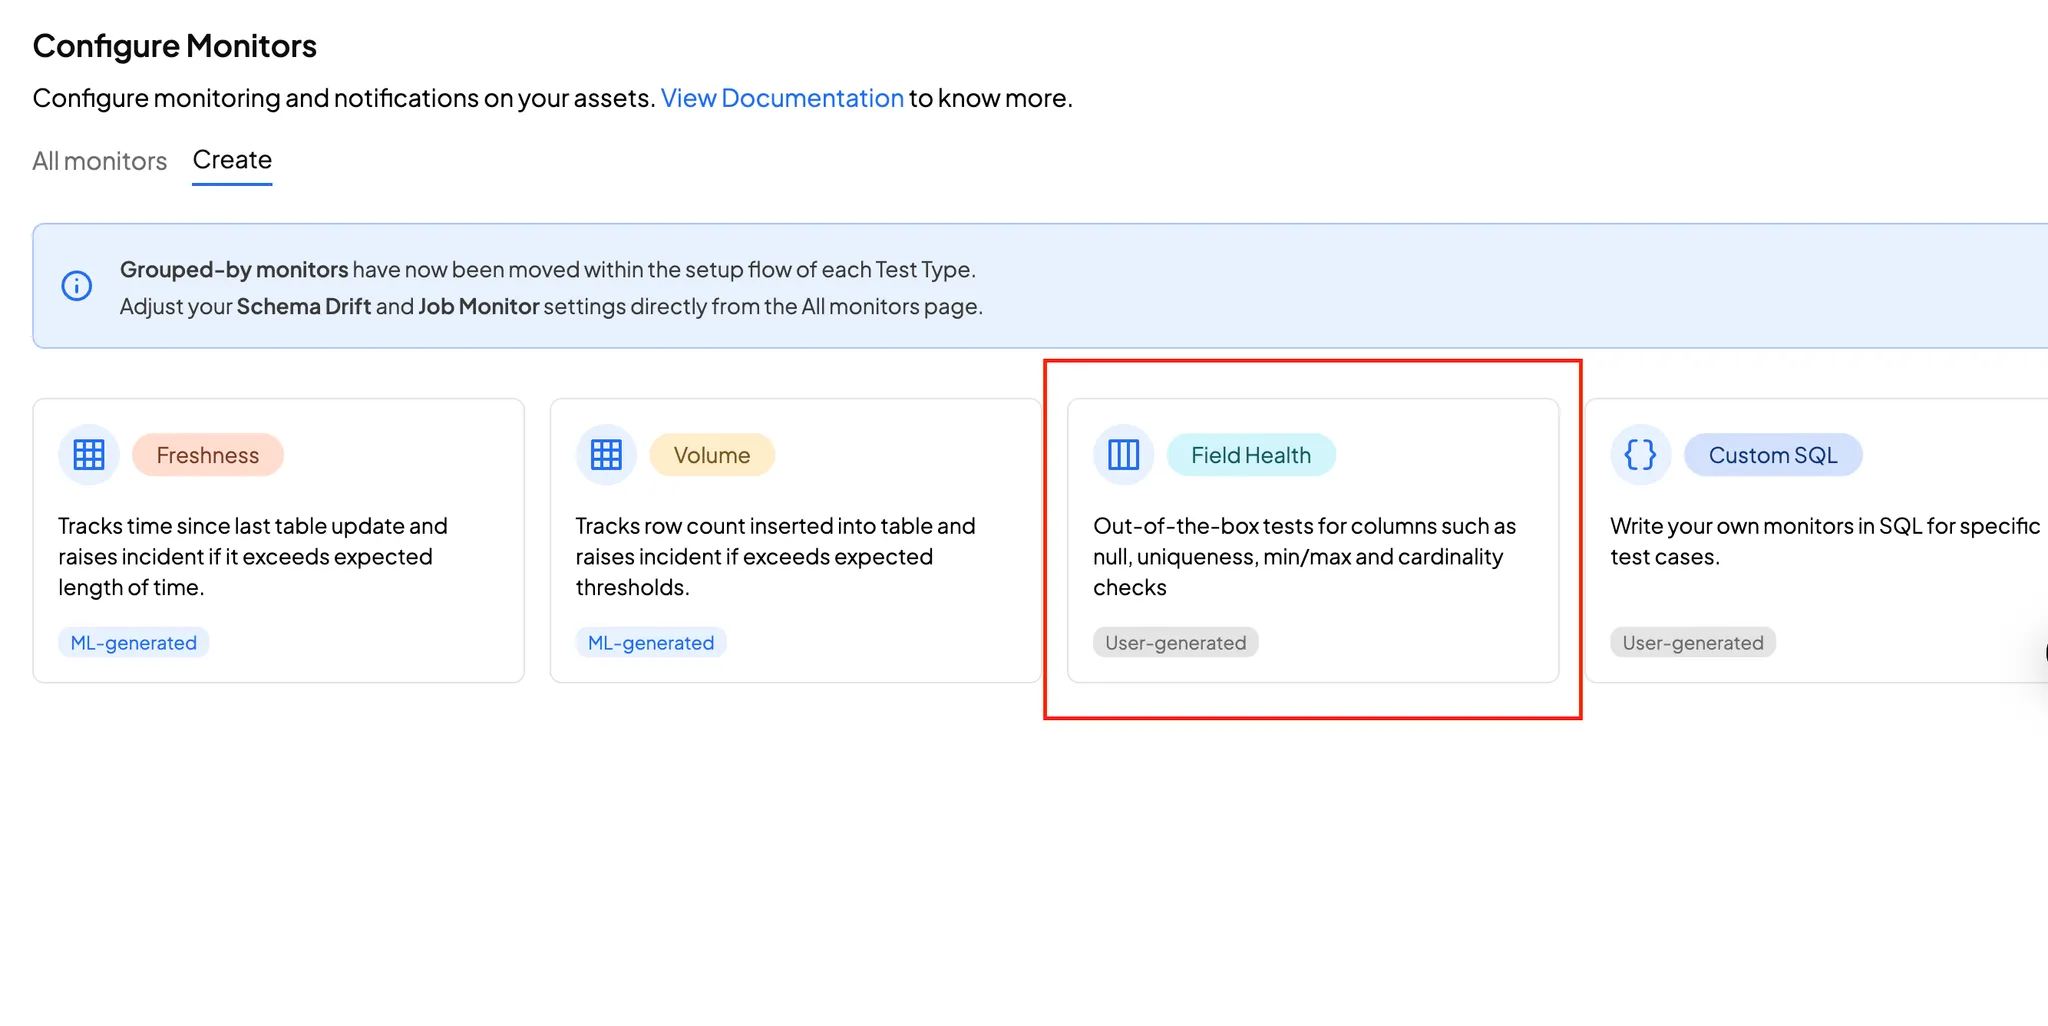
2. Select the **“Field Health”** card.

<figure><img src="/files/5SAy4u88rce2PXqVvj7Q" alt=""><figcaption><p>Selecting Field Health Card</p></figcaption></figure>

You can also activate field health monitoring within the "Asset Details" section of the Data Catalog Module. This can be done via the "Monitors" tab.

For more detailed information you can refer to below link

{% content-ref url="/pages/eRwubVBjQKYfSlbVC3T1" %}
[Catalog: Add/Modify Monitor](/data-quality/how-to-set-up-monitors/catalog-add-modify-monitor.md)
{% endcontent-ref %}

Once selected, you’ll be redirected to the **“Create a New Monitor”** form.

* The **“Create a New Monitor”** form consists of two steps:

  **Setup**

  **Configure**

{% hint style="info" %}
The form fields will become available as you select the mandatory options.
{% endhint %}

### Step 1: Set-up

* Choose the `test type` from the dropdown. The available test types are:
  1. **Null** — Monitors null values. Supports Absolute (row count), Percentage, and Auto threshold modes.
  2. **Unique** — Monitors duplicate values. Supports Absolute, Percentage, and Auto threshold modes.
  3. **Average** — Computes the column average and compares it against a Range threshold or Auto mode. Numeric columns only.
  4. **Min** — Identifies the minimum value in a column. Supports Range and Auto threshold modes. Numeric columns only.
  5. **Max** — Identifies the maximum value in a column. Supports Range and Auto threshold modes. Numeric columns only.
  6. **Cardinality** — Tracks the number of distinct values in a column using a 5-period rolling window. See [How Cardinality detection works](#cardinality-detection) below. Scheduled mode only.
  7. **String Length** — Validates string lengths. Supports Range and Auto threshold modes.
  8. **Email** — Monitors invalid email addresses. Supports Absolute, Percentage, and Auto threshold modes.
  9. **UUID** — Monitors invalid UUIDs. Supports Absolute, Percentage, and Auto threshold modes.
  10. **Regex Match** — Validates values against a user-defined pattern. Specify the pattern separately from the threshold. Supports Absolute, Percentage, and Auto threshold modes.
* **Important Note for Synapse/SQL Server Users:**

When setting up the Match REGEX threshold for data quality monitoring:

• `Synapse/SQL Server` requires `string` matching patterns instead of standard REGEX syntax.

• Ensure that the value entered in the “Set Threshold” field aligns with the string pattern supported by `Synapse/SQL Server`.

{% hint style="info" %}
If the current preset field tests is not sufficient to run the specific test you require, you can also create a test via custom SQL script.

[Custom SQL Monitor](/data-quality/how-to-set-up-monitors/custom-sql-monitors.md)
{% endhint %}

* Select the `data source` **&** Filter by `Schema` is **optional.**
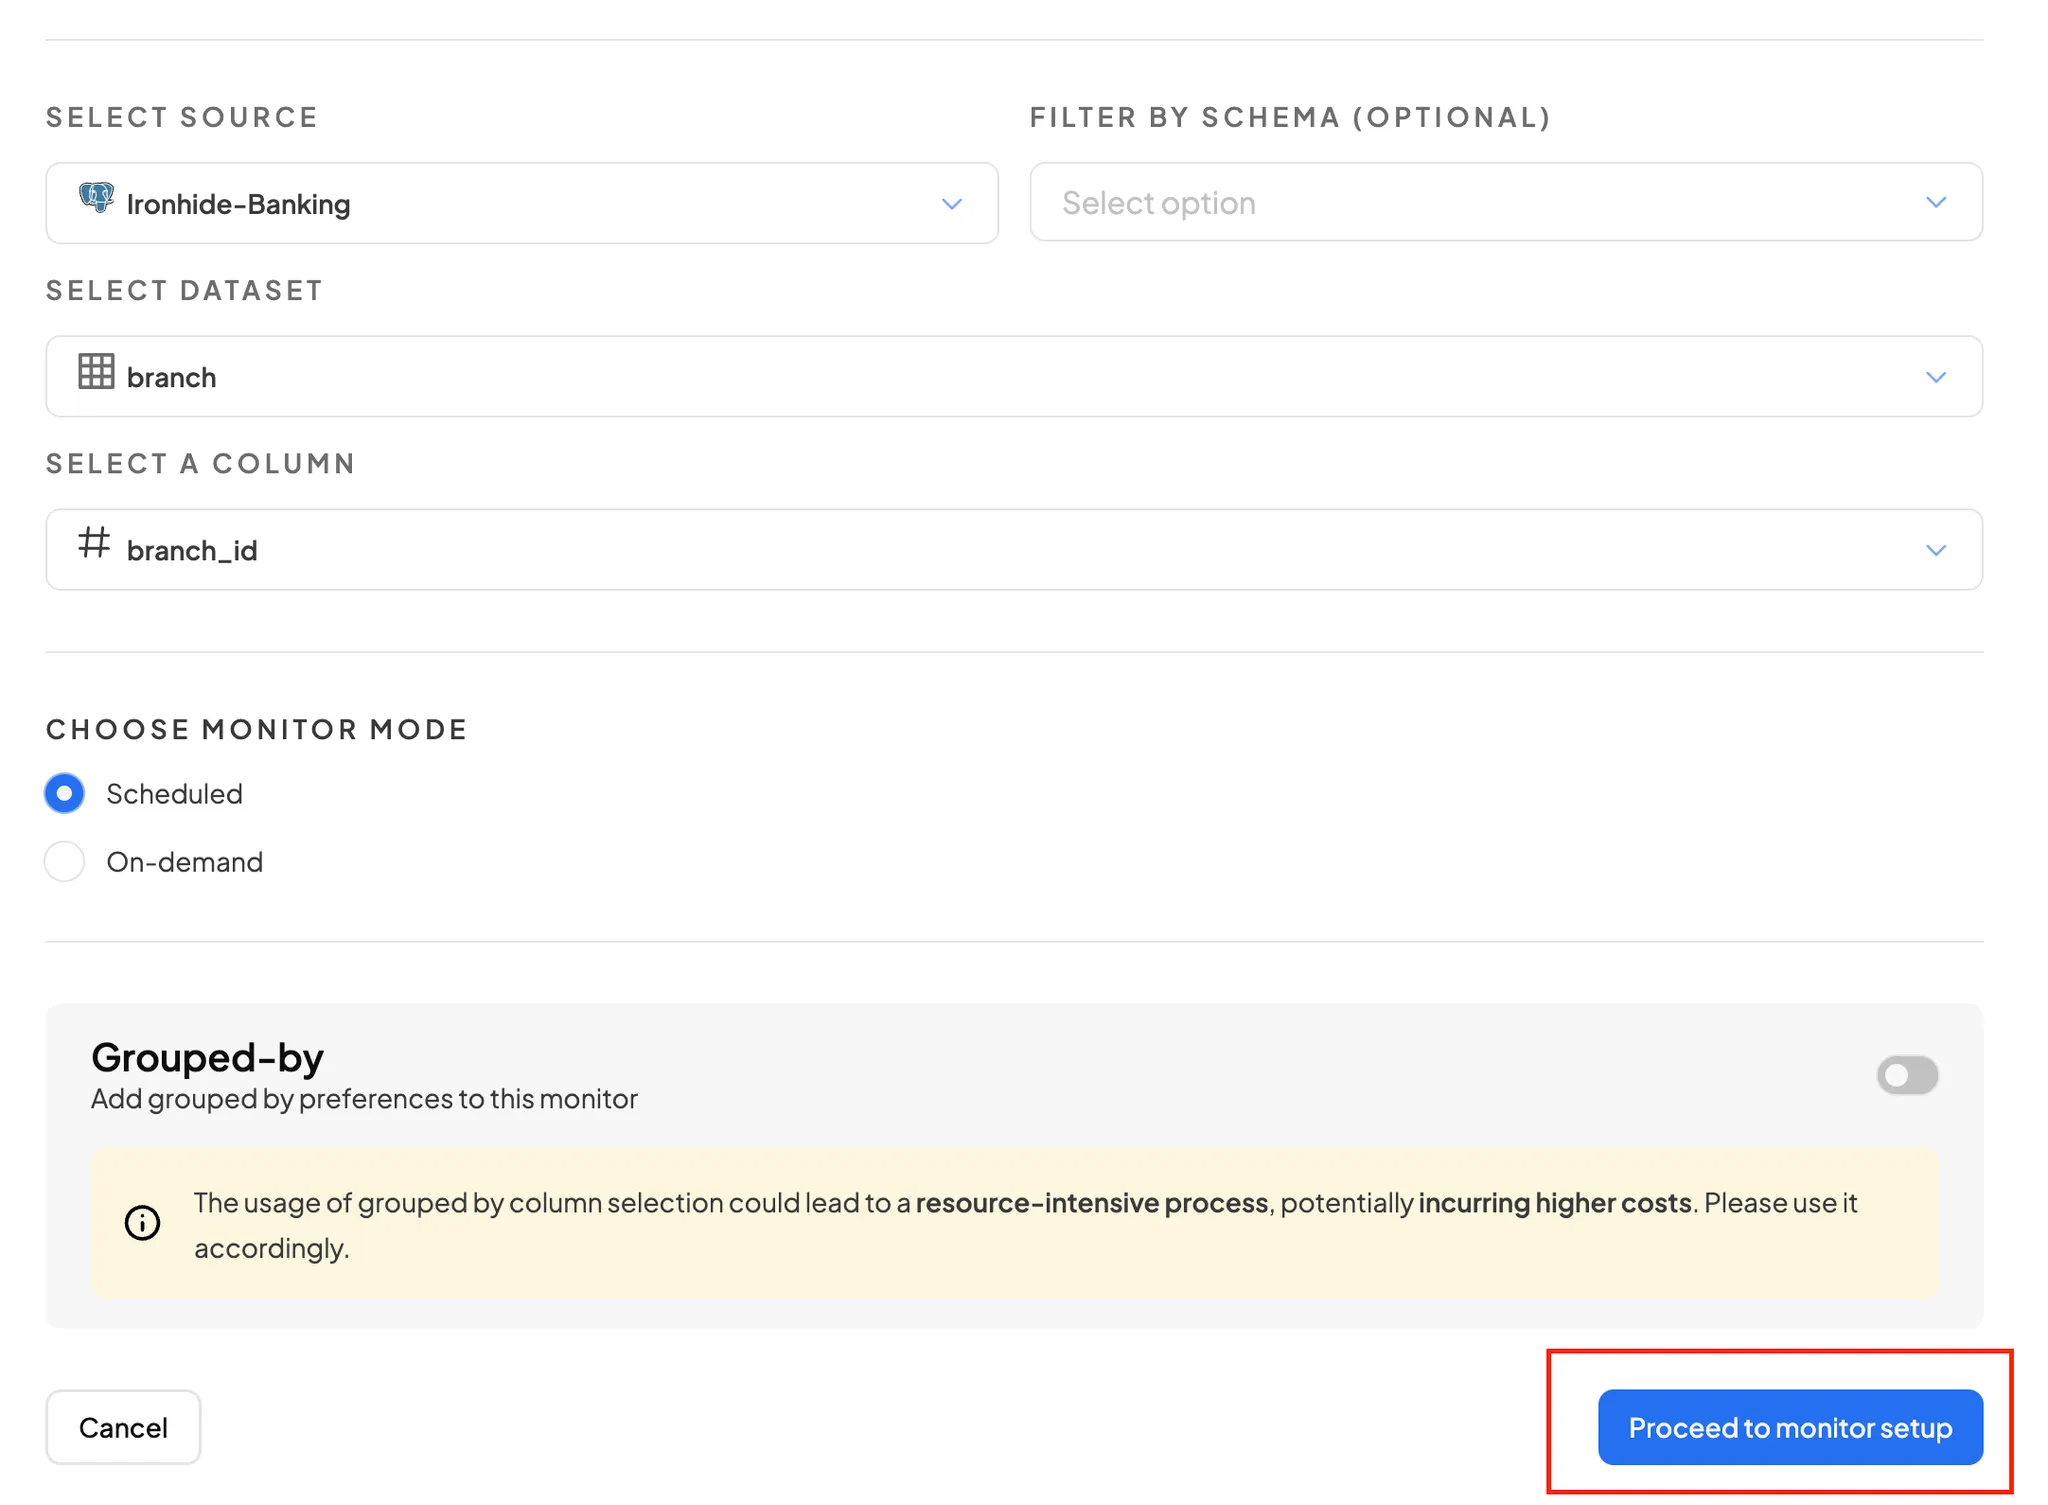
* Select the `dataset` and `Column` you want to monitor.
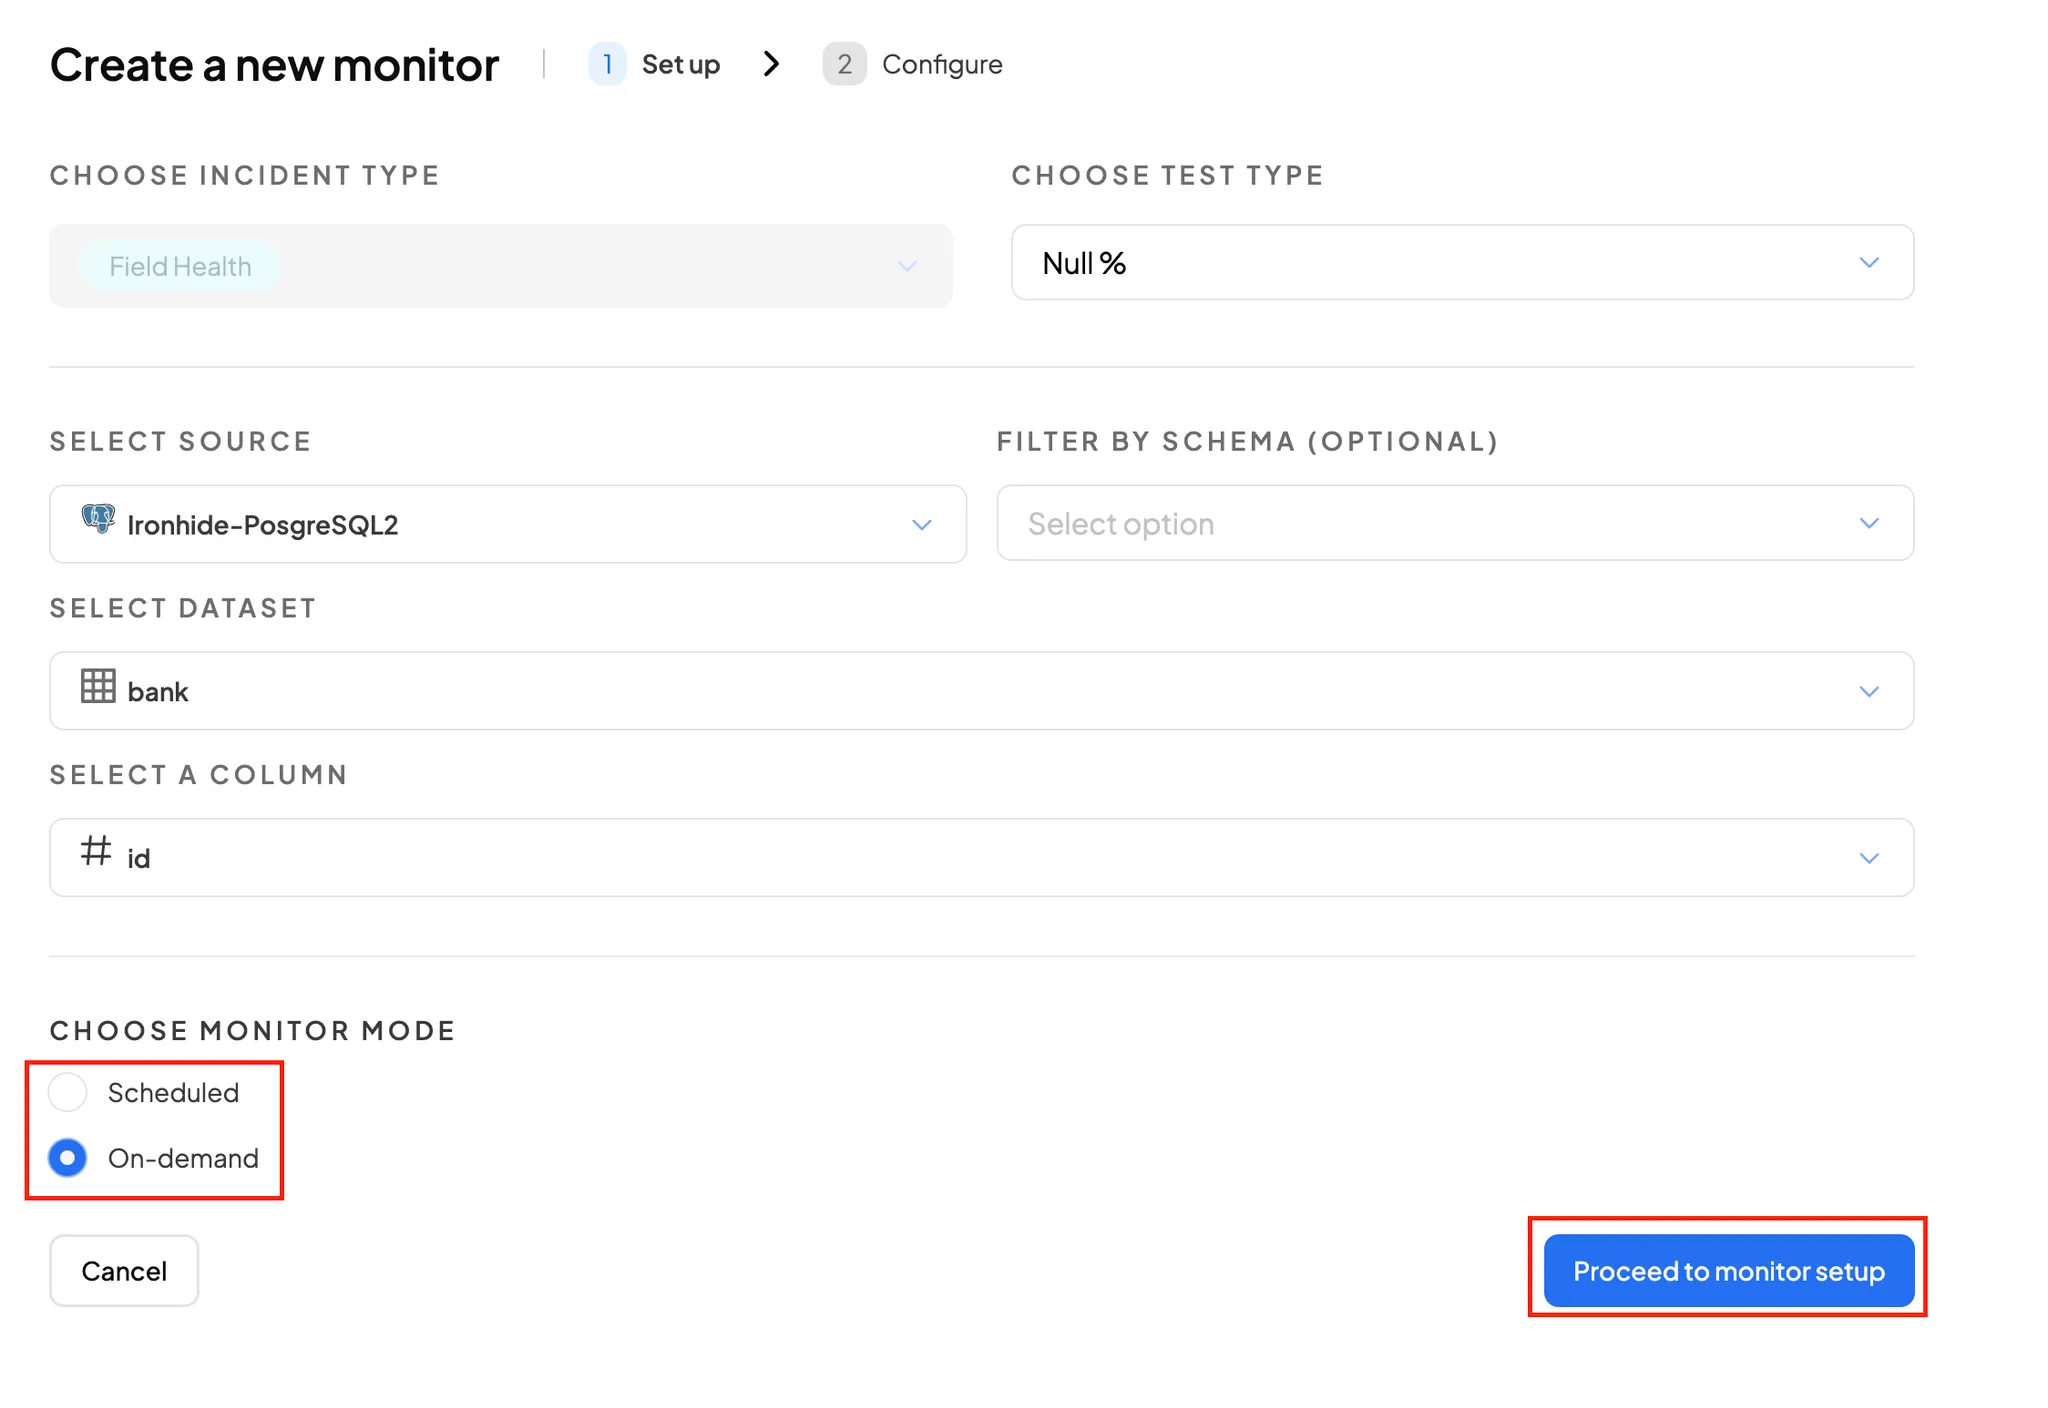
* Choose `Monitor mode`: Scheduled or On-Demand

{% hint style="info" %}
For a detailed understanding of monitor modes, check out [**Available Monitor Modes**](/data-quality/monitor-configuration-settings/available-monitor-modes.md)
{% endhint %}

<figure><img src="/files/Hv3WygzDL8cfJ5sI8KFN" alt=""><figcaption></figcaption></figure>

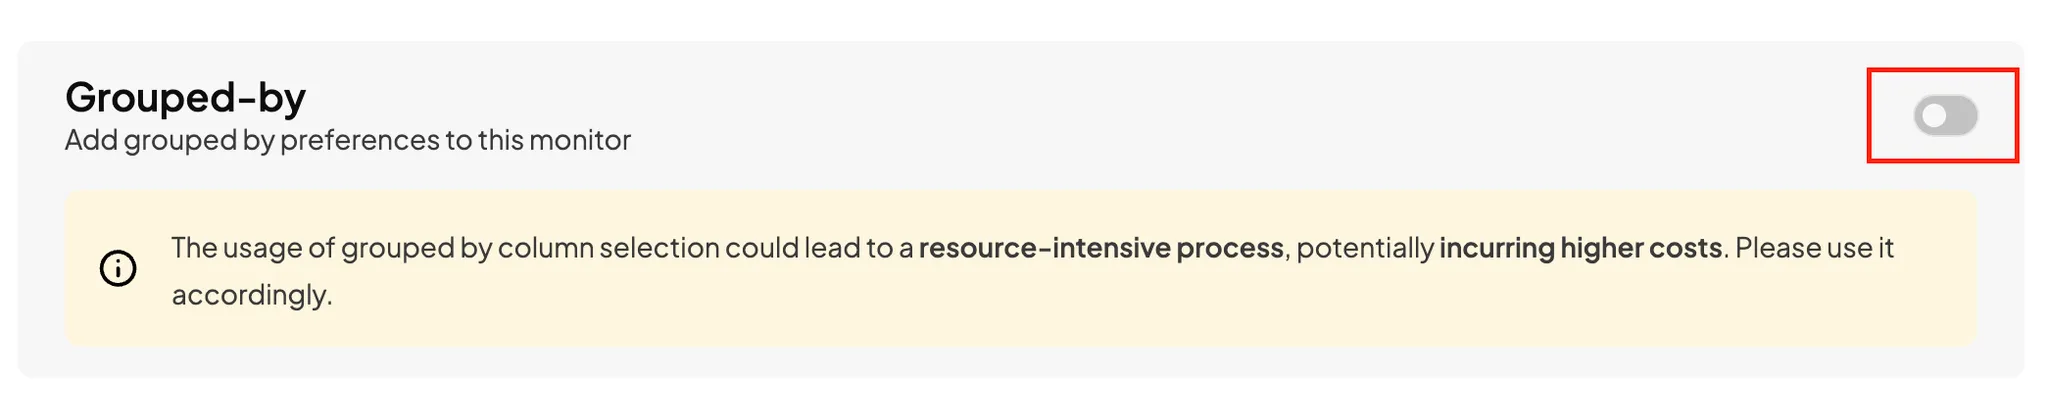
* **Enable “Grouped By” (if applicable)** by toggling the switch.
* Select the column for grouping and click **Validate**.
* A success message (**“Column is valid to be grouped by”**) confirms validation.

<figure><img src="/files/66IICwpw2FGASU27FYSb" alt=""><figcaption><p>Grouped-By Disabled</p></figcaption></figure>

<figure><img src="/files/9hmK7NX6RGGJppwtySd0" alt=""><figcaption><p>Grouped-by enabled</p></figcaption></figure>

* Click **“Proceed to Monitor Setup”** to move to the next step.

<figure><img src="/files/EasaTvDLH7EYBzVRV6tQ" alt=""><figcaption><p>Choose Monitor Mode</p></figcaption></figure>

### Step 2: Configure: Scheduled Monitor

* Once you proceed to setup, you’ll reach the **”Configure”** page, where you can review your previous selections.

Complete the required fields in the **Configure** form:

{% hint style="info" %}

* Can create multiple tests for each test type per column/table

* Able to add a test name to differentiate monitors created
  {% endhint %}

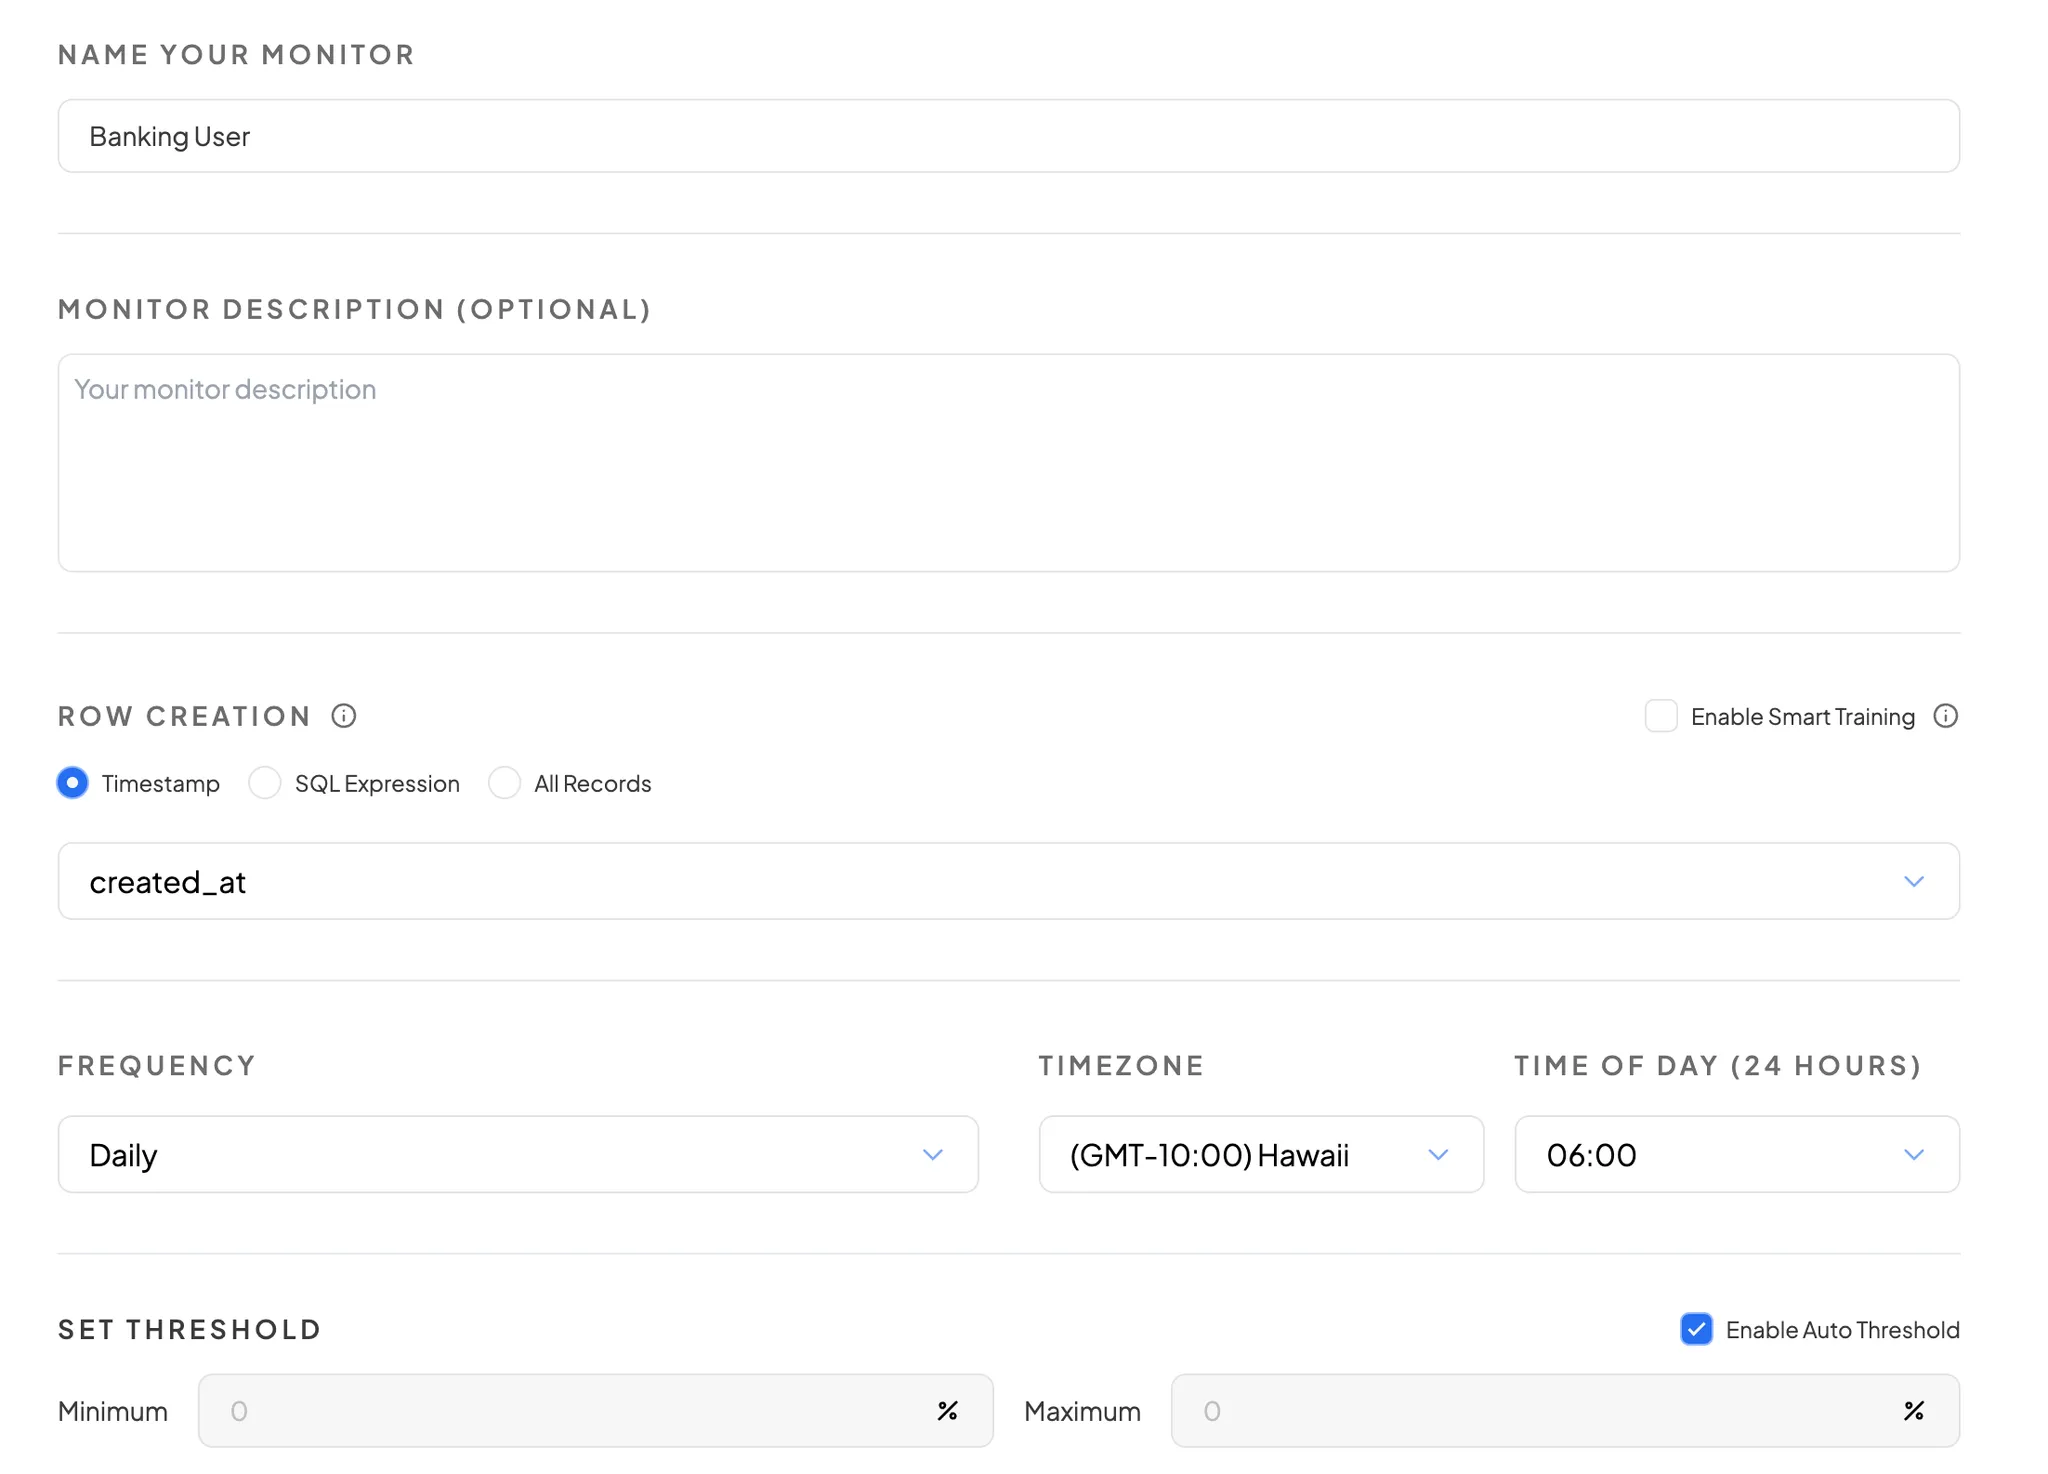
* **Monitor Name**

* **Monitor Description** is Optional.

* **Row Creation:** Select the Row creation from given options:
  * **Timestamp** (Select Timestamp from the dropdown column)
  * **Validation for SQL Expression** (when SQL Expression is chosen)
  * **All Records**
  * **Enable Smart Training(Optional):** Train your monitor on historical data to reduce the training period

* **Frequency** (Learn more about [**Custom Scheduling For Monitors**](/data-quality/monitor-configuration-settings/custom-scheduling-for-monitors.md))

* **Threshold Mode:** Select the appropriate threshold type based on your test:
  * **Absolute (Row Count):** Set thresholds based on number of rows (e.g., "fail when > 100 invalid rows")
    * Available for: Null, Unique, Email, UUID, Regex Match
    * Input: Non-negative integer values for min/max bounds
  * **Percentage:** Set thresholds based on percentage (e.g., "fail when > 5% nulls")
    * Available for: Null, Unique, Email, UUID, Regex Match
    * Input: Integer values between 0-100 for min/max bounds
  * **Auto (Machine Learning):** Let the system learn acceptable patterns from historical data
    * Only available for scheduled monitors
    * Available for: Null, Unique, Email, UUID, Regex Match, Average, Min, Max, String Length
    * No manual threshold input required
  * **Range:** Set numeric range thresholds for statistical tests
    * Available for: Average, Min, Max, String Length
    * Input: Min/max bounds (at least one required)

* **Set Threshold:** Configure min/max values based on selected threshold mode
  * At least one bound (min or max) is required
  * For percentage mode: values must be 0-100
  * For absolute mode: values must be non-negative integers
  * For range mode: constraints depend on test type

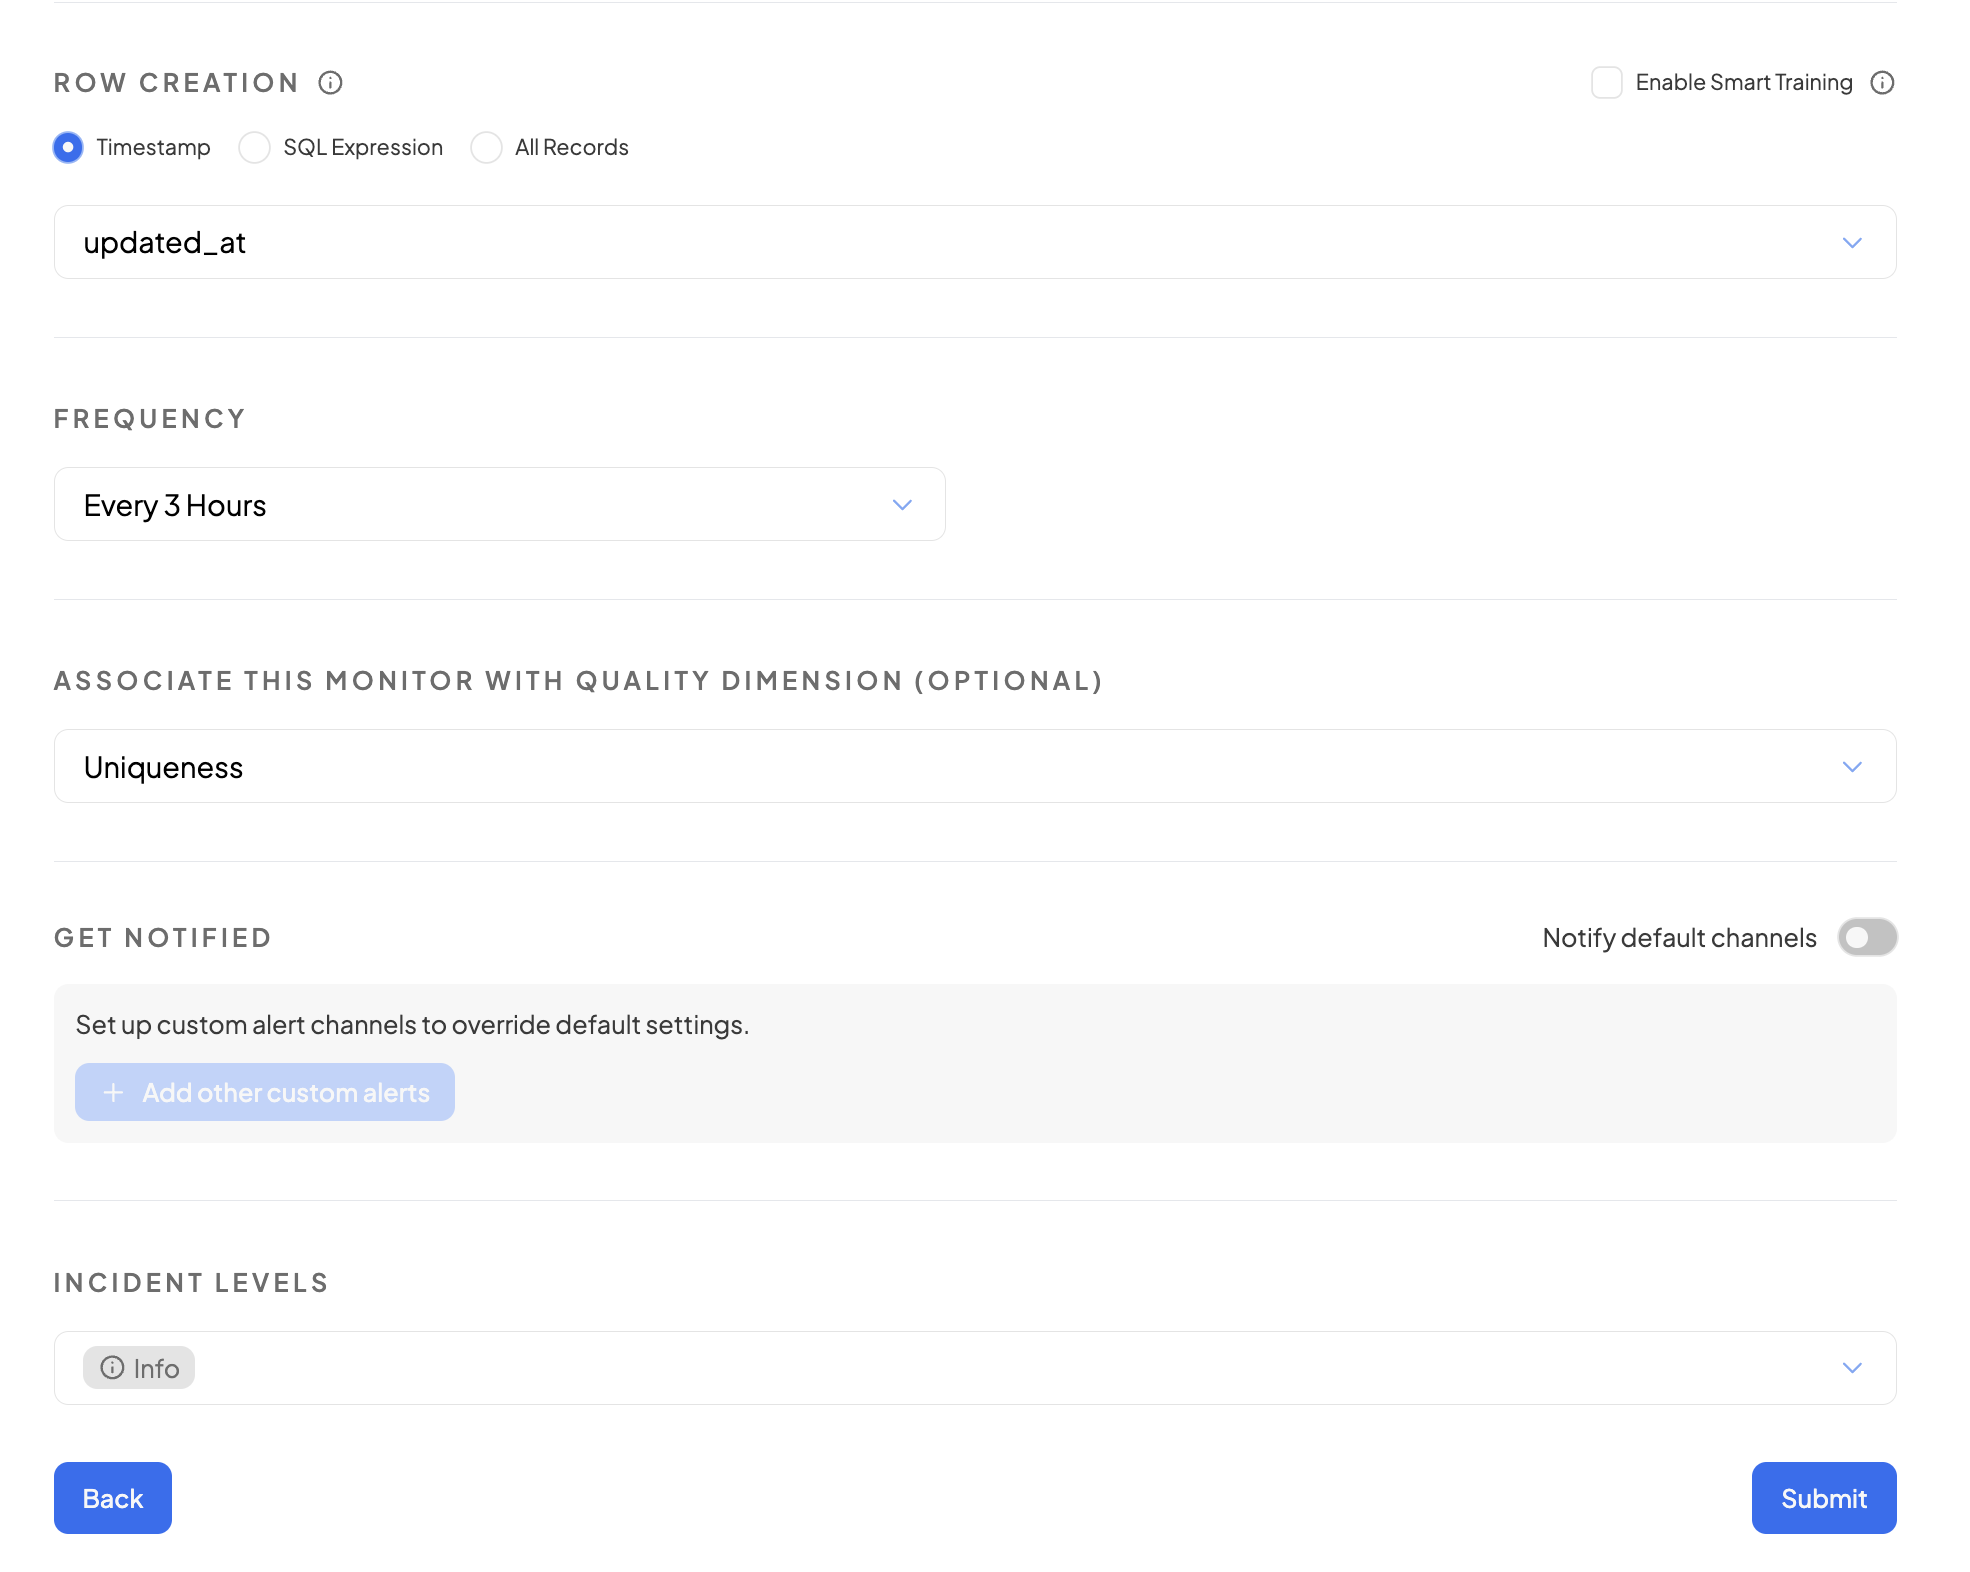
* **Quality Dimension (Optional) for more understanding refer to** [supported test types](#supported-monitors-with-default-quality-dimension)

{% hint style="info" %}
When using **SQL Expression**, validating your query is compulsory. Ensure that your query is written in the dialect compatible with your linked data source, as illustrated below:

**Google BigQuery** - `CAST(your_string_column AS DATETIME)`

**PostgreSQL** - `your_timestamp_column::timestamp`

When working with Google BigQuery, you can review the provided documentation for further details here.
{% endhint %}

{% hint style="info" %}
**Smart Training** requires Row Creation to be selected.

To activate Smart Training in Row Creation:

* Users should initially select the timestamp.
* If SQL Expression is chosen for row creation, validate the SQL Expression before saving.
  {% endhint %}

{% hint style="info" %}
**Regex Match Test:** When configuring a Regex Match test, you'll specify the regex pattern in a separate field in the test configuration (not in the threshold). The threshold controls how many non-matching values will trigger an incident.
{% endhint %}

### Cardinality detection

Cardinality uses a rolling-window approach rather than the ML model used by other Auto tests. Each scan compares the current distinct-value count against the average of the **preceding 5 scan results**. If the current count falls outside the expected range based on that window, Decube opens an incident.

Because this method derives its baseline from recent history rather than a training run, Cardinality does not have a training period and is not affected by the [sparse-data threshold](/data-quality/anomaly-detection-explained.md#sparse-data-and-silent-skipping) that applies to Smart Training monitors. The rolling window does require at least 5 prior scan results before it can produce meaningful comparisons — a newly created Cardinality monitor will not raise incidents until 5 scans have completed.

{% hint style="info" %}
Cardinality is only supported in **Scheduled** mode. On-Demand mode is not available for this test type.
{% endhint %}

***

<figure><img src="/files/QCQmRZbczx0QDzDOtcDC" alt=""><figcaption><p>Overview for setting-up frequency</p></figcaption></figure>

<figure><img src="/files/4ZXlOKTUiVoBLgV55ezh" alt=""><figcaption><p>Overview of set-up monitor with supported quality dimension</p></figcaption></figure>

### [Get Notified/Custom Alert](#get-notified-custom-alert)

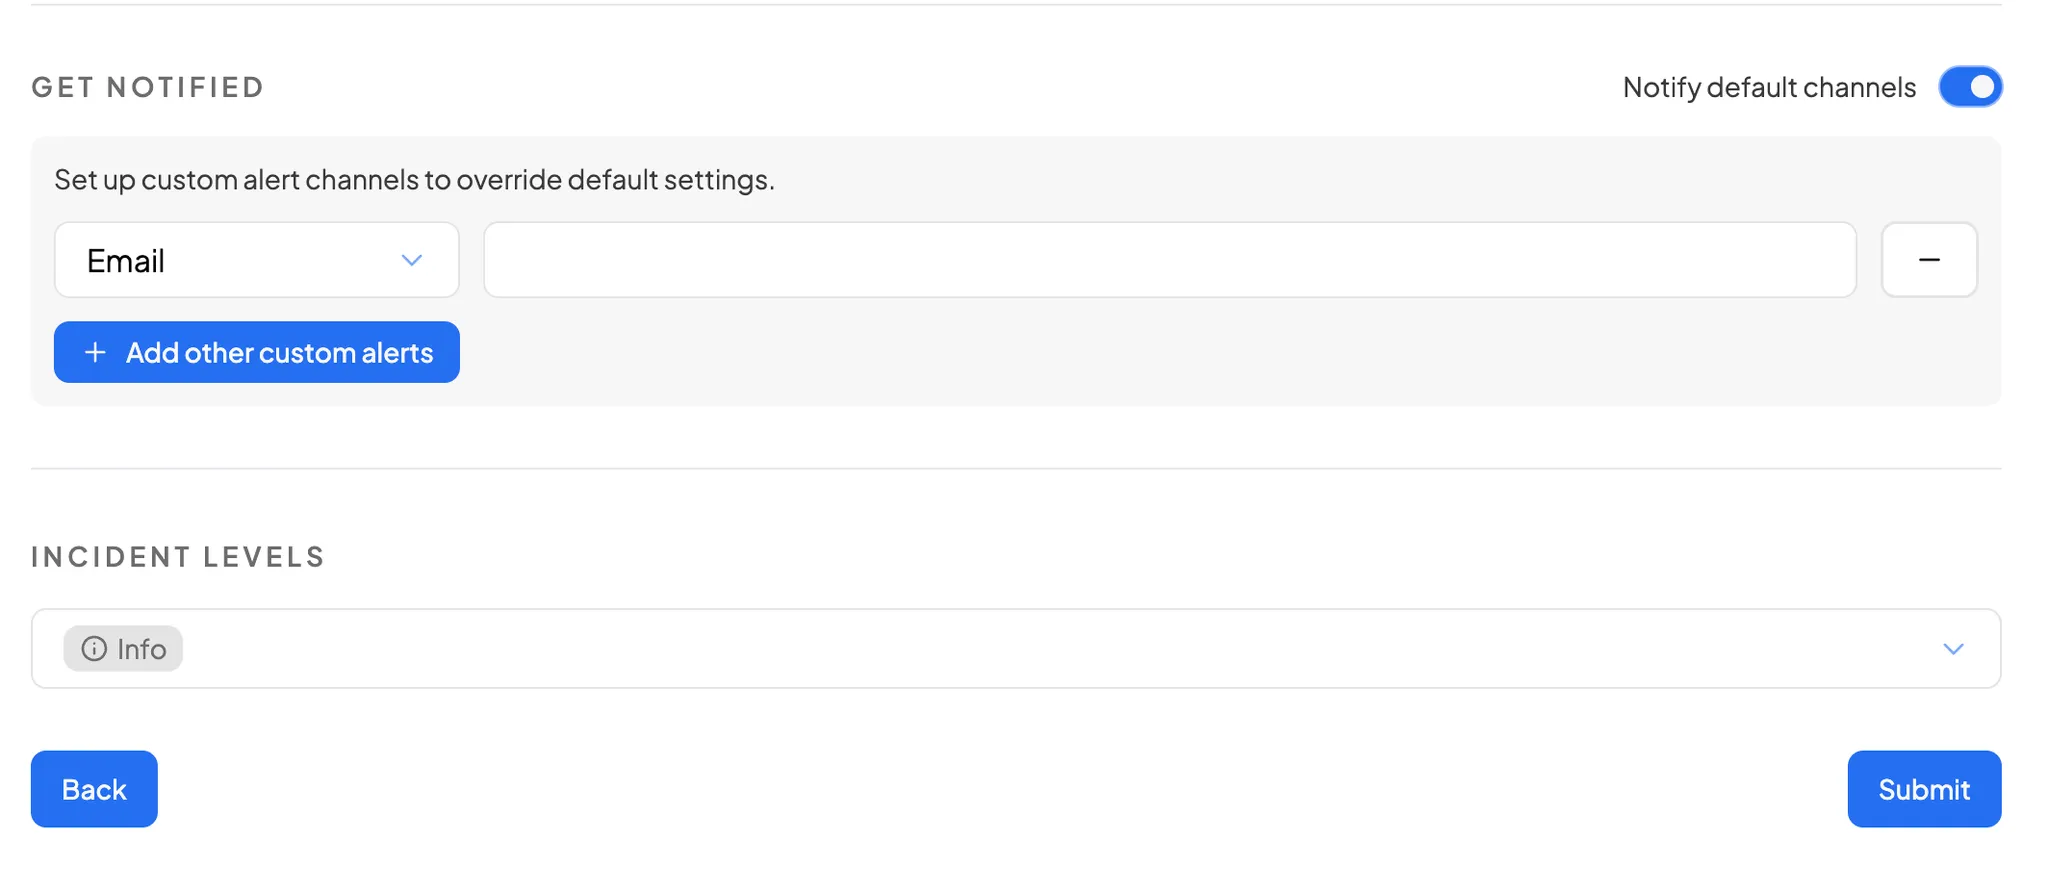
* To set custom alerts, turn on the `"Notify default channel"` toggle, then select your preferred alert channels (email or Slack) from the dropdown.
  * You can select the desired alert channels in the dropdown.
  * Mention the address or channel name in the field.
* At last Specify the **Incident Level**.

<figure><img src="/files/nAKTlcqfooVEsnKo9sEz" alt=""><figcaption><p>Setting-up notification/custom alert</p></figcaption></figure>

* Click on `Submit` and your monitor is created successfully.
* Once monitor is created successfully you will be redirected to ALL MONITORS tab.

### Step 2: Configure: On-demand Monitor

{% hint style="info" %}
**Note: Key Differences:** i. The "`Frequency`" field is not relevant for configuring any On Demand monitors and is therefore neglected.

ii. “`Enable Smart Training`”"`Auto Threshold`" options is neglected when it comes to setting up any On Demand Monitor.

iii. `Grouped By` is not available for On-demand monitor mode.
{% endhint %}

* Select **On-Demand** as the Monitor Mode and click **“Proceed to Monitor Setup”**.

<figure><img src="/files/KrA946COD5RejnZzIxTJ" alt=""><figcaption><p>Choosing monitor mode</p></figcaption></figure>

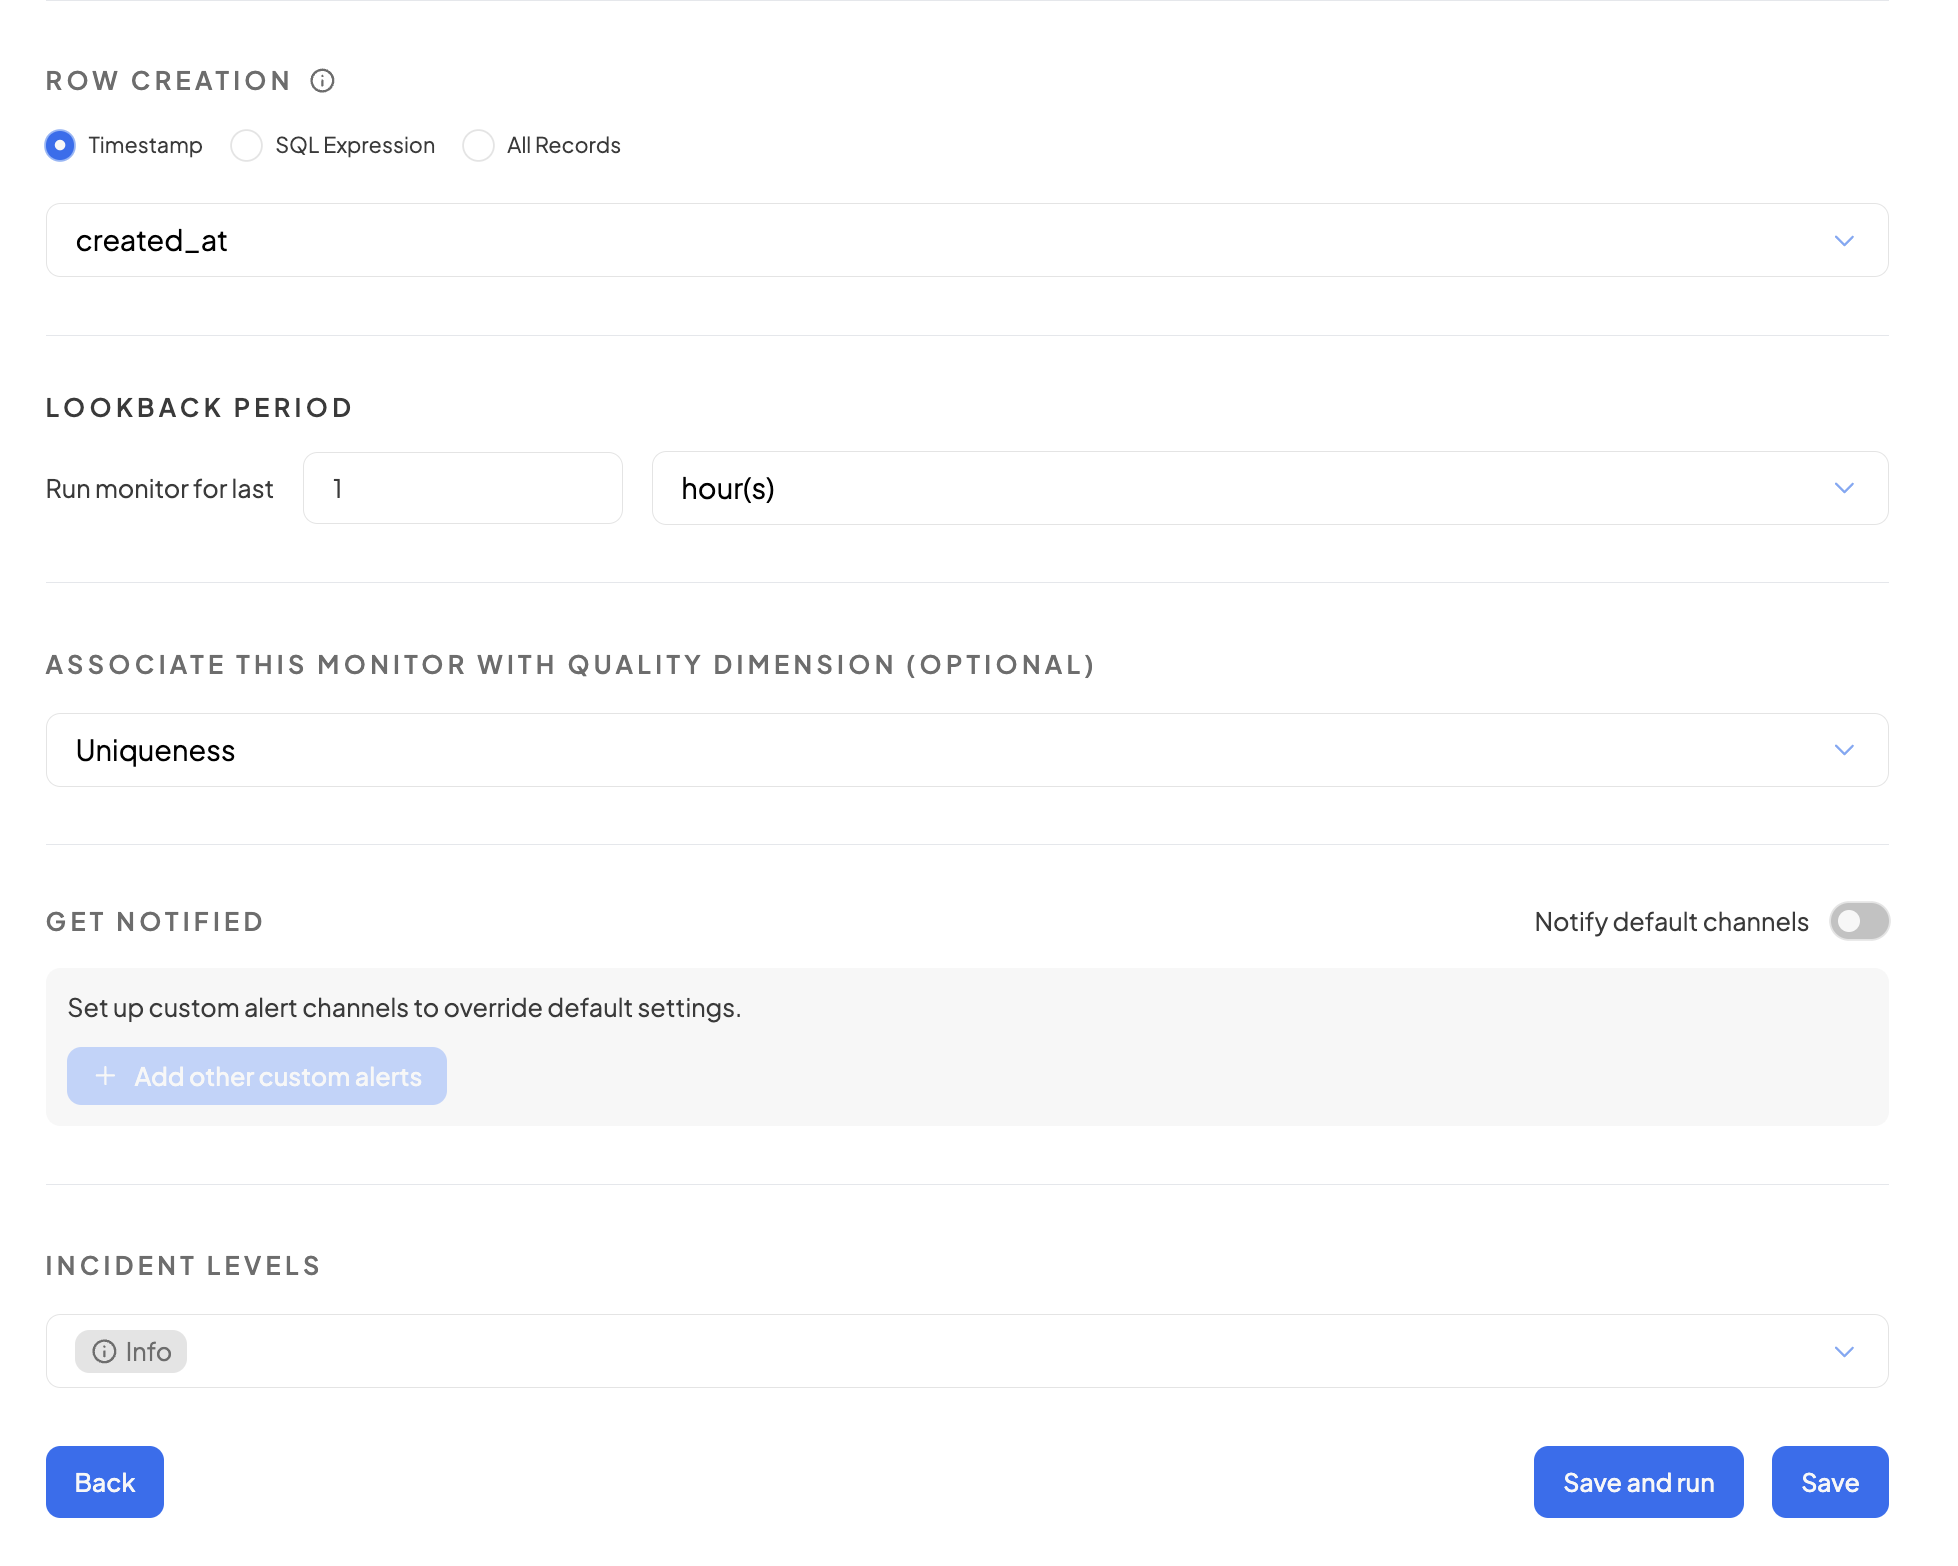
* Complete the required fields in the **Configure** form:

{% hint style="info" %}

* Can create multiple tests for each test type per column/table
* Able to add a test name to differentiate monitors created
  {% endhint %}

- **Monitor Name**
- **Monitor Description** is Optional.
- **Row Creation:** Select the Row creation from given options:
  * **Timestamp** (Select a timestamp column from the dropdown)
  * **Validation for SQL Expression** (when SQL Expression is chosen)
  * **All Records**
- **Lookback Period**
- **Threshold Mode:** Select the appropriate threshold type:
  * **Absolute (Row Count):** For Null, Unique, Email, UUID, Regex Match
  * **Percentage:** For Null, Unique, Email, UUID, Regex Match
  * **Range:** For Average, Min, Max, String Length
  * Note: Auto threshold is not available for on-demand monitors
- **Set Threshold:** Configure min/max values (at least one required)
- **Quality Dimension (Optional) for more understanding refer to** [supported test types](#supported-monitors-with-default-quality-dimension)
- **Incident Levels**

<figure><img src="/files/7U50oTzV6KbvRz8LnNkj" alt=""><figcaption><p>On-demand monitor configuration</p></figcaption></figure>

{% hint style="info" %}
**Custom Notifications:** Custom alerts can be configured as in scheduled monitors.

[**Get Notified/Custom Alert**](#get-notified-custom-alert)
{% endhint %}

**Finalizing On-Demand Monitor Setup**

* To finish, choose one of the following:
  * `Save` — creates the monitor without running it immediately.
  * `Save and Run` — creates and runs the monitor straight away. To run it again later, navigate to **All Monitors**.
  * After selecting the above option you will be redirected to ALL MONITORS tab.
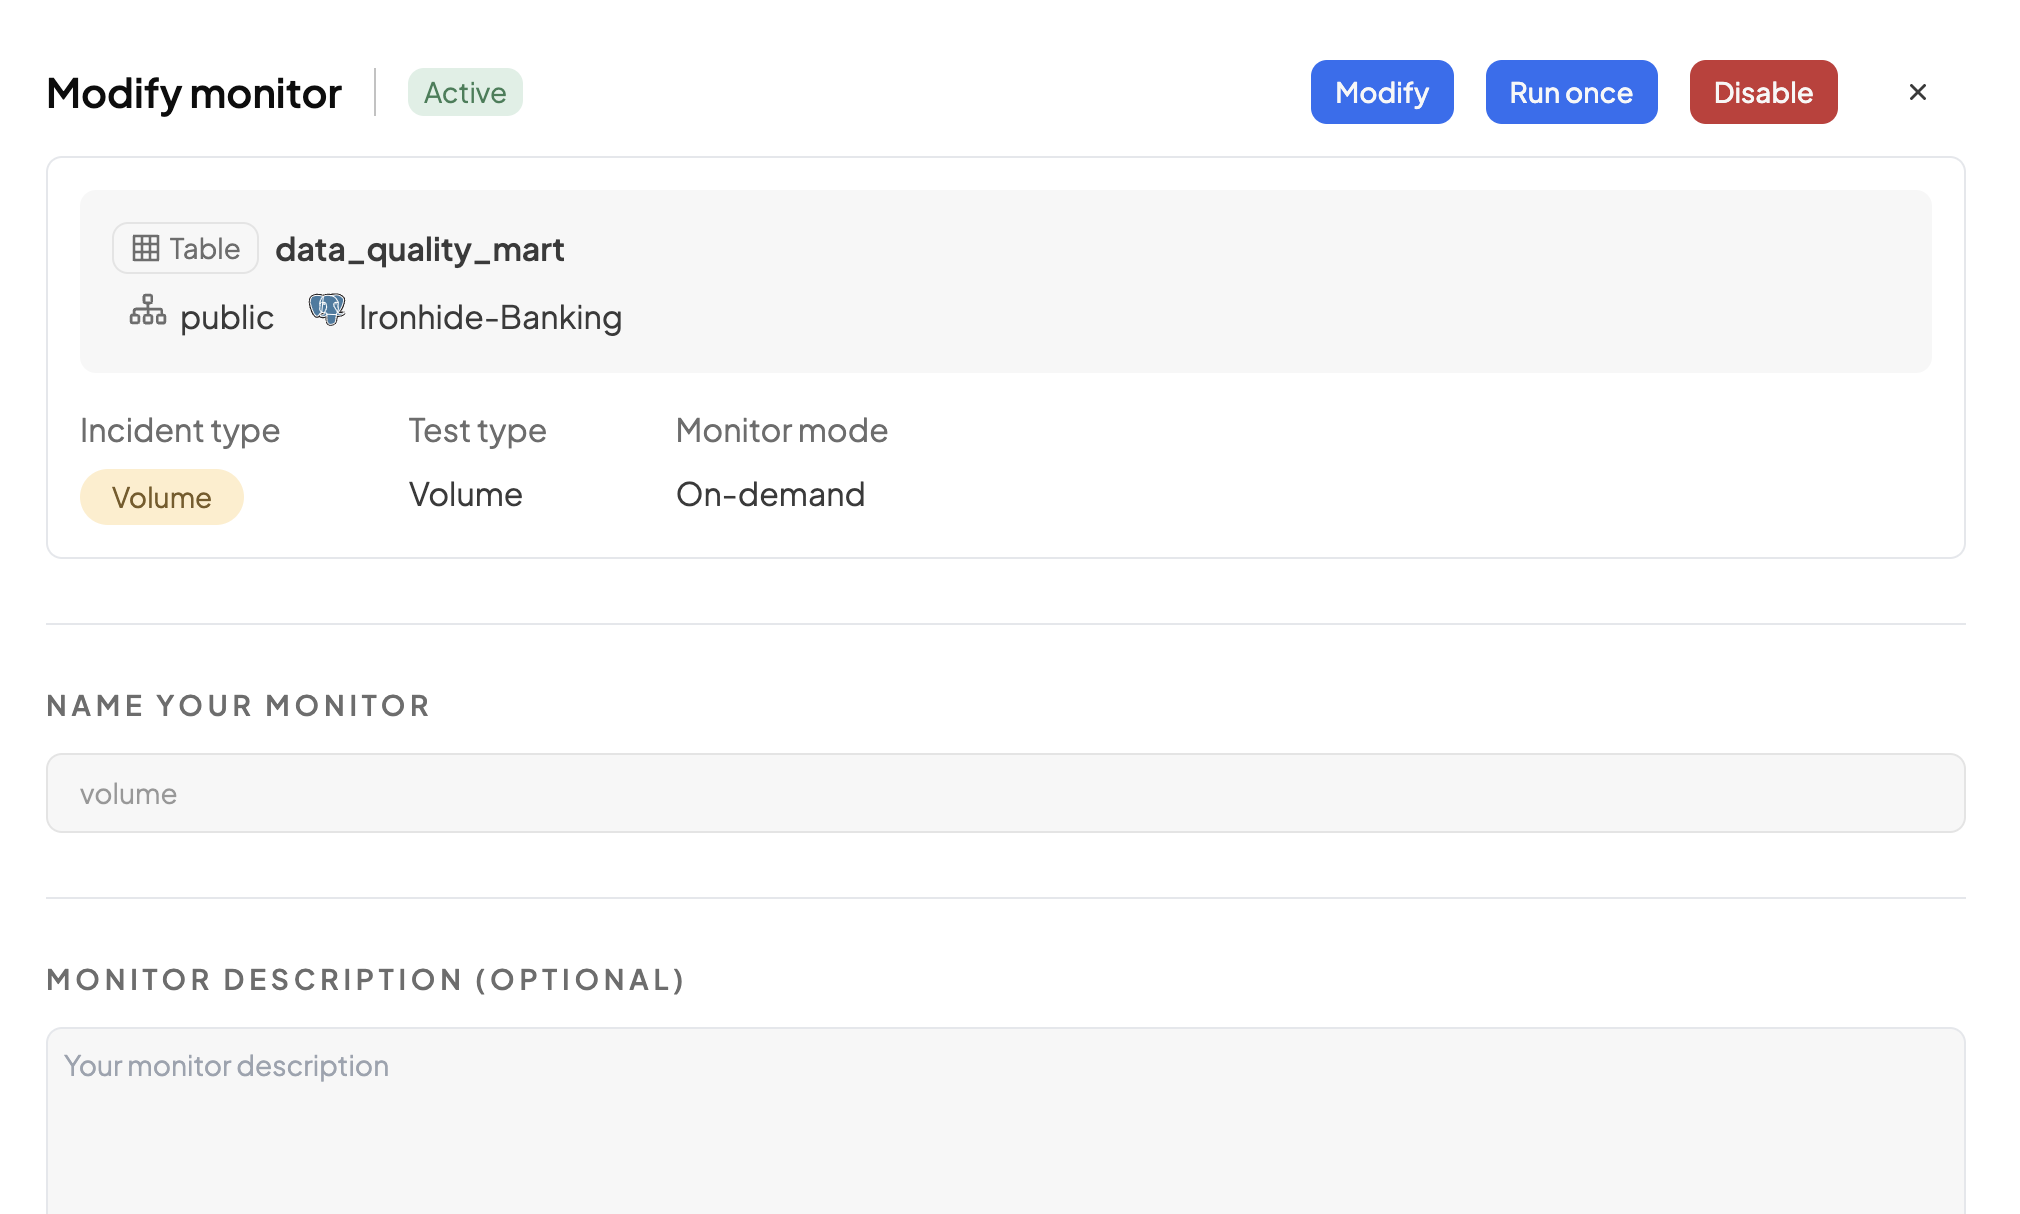
* **Modify Monitoring**

To modify an existing monitor:

1. Go to [**All Monitors**.](/data-quality/enable-asset-monitoring.md#all-monitors-tab)
2. Click the ellipsis (︙) and select **View Monitor**.
3. Click on `Run once` to run the monitor manually.

<figure><img src="/files/w6ogeOB3ZlK0W9n7Webl" alt=""><figcaption><p>Modify Monitor from All Monitors</p></figcaption></figure>


---

# Agent Instructions: Querying This Documentation

If you need additional information that is not directly available in this page, you can query the documentation dynamically by asking a question.

Perform an HTTP GET request on the current page URL with the `ask` query parameter:

```
GET https://docs.decube.io/data-quality/how-to-set-up-monitors/set-up-field-tests.md?ask=<question>
```

The question should be specific, self-contained, and written in natural language.
The response will contain a direct answer to the question and relevant excerpts and sources from the documentation.

Use this mechanism when the answer is not explicitly present in the current page, you need clarification or additional context, or you want to retrieve related documentation sections.