> For the complete documentation index, see [llms.txt](https://docs.decube.io/llms.txt). Markdown versions of documentation pages are available by appending `.md` to page URLs; this page is available as [Markdown](https://docs.decube.io/overview/changelog/archive/2024.md).
# 2024
Decube releases in 2024.
## \[Release 1.22.0] 23 Dec 2024
* Added Support for Oracle Integration: Decube now supports Oracle as a data source, enabling users to seamlessly create and manage Oracle connections. For details on setting up and granting privileges, refer to the [Oracle integration documentation](https://docs.decube.io/databases/oracle).
## Public API BETA- Phase 1
* We’ve launched Public API, available exclusively for Enterprise-tier customers. Platform Owners can now generate user-specific API keys through the Update Profile Settings under a new section below MFA. Users can generate multiple keys and access direct links to API documentation for supported endpoints.
* This release includes APIs for Glossary Management (create, update, delete terms) and Lineage Management (manual lineage definitions), providing seamless programmatic access to streamline workflows with Decube.
* For more details, refer to the [Public API Overview](https://docs.decube.io/public-api/overview).
## \[Release 1.20.0] 26 Nov 2024
Decube launched ADLS Monitoring, to enhance metadata tracking and event-based catalog management. This release supports Filter Modes such as Files Updated and All Records for more flexible monitoring workflows.
## \[Release 1.19.0] 08 Nov 2024
Decube is introducing a new AI feature that enables users to effortlessly generate asset descriptions in Catalog > Asset Details > Schema using Decube AI. This enhancement allows users to auto-generate comprehensive descriptions, improving metadata quality while reducing manual effort. The UI in Asset Details > Schema has been updated with an intuitive interface featuring a “Write with Decube AI” button for generating new descriptions, as well as a “Re-write with Decube AI” option for re-writing the existing ones, streamlining the process of adding and enhancing descriptions.
## \[Release 1.17.0] 14 Oct 2024
* **\[Iceberg with AWS Glue]:**
* Decube introduced beta support for ingesting Apache Iceberg tables through AWS Glue Catalog. For more information on how to add this connector, you can refer to [Apache Iceberg (BETA)](https://docs.decube.io/datalake/apache-iceberg)
## \[Release 1.15.0] 03 Sept 2024
* **Azure Synapse Apache Spark Integration**\\
* Added Support for Apache Spark Integration: Introduced a streamlined process for connecting Decube to Apache Spark within Azure Synapse Analytics Workspace. This includes the ability to create Spark data sources in Decube, integrate with Azure Synapse using OpenLineage, and configure Apache Spark for seamless data lineage tracking and management. For information, you can refer to [Apache Spark in Azure Synapse](https://docs.decube.io/transformation-tools/apache-spark/apache-spark-in-azure-synapse)
## \[Release Version 1.14.0] 02 Sept 2024
**Incidents Tab:**
* **Search Functionality**: Search functionality is improved now user can search for incidents based on asset:
* Can search by direct asset (eg. search for column name to get incidents on columns)
* Can search by parent asset (eg. search for table name to get incidents on the columns)
* Filtering Capability is added, now user can filter by:
* Incident type & Test types
* Incident levels
* Incident status
* Monitor mode
* Assignee
* Schema drift incidents now show up in the Asset details - Incidents for the Asset.
## \[Release Version 1.11.0] 26 August 2024
**Glossary > Linked Assets**
* Improved user experience of adding a linked assets in the Linked Assets tab.
* Allow users to add new asset types as a linked asset: Dashboard, charts and more.
* Added new filters to the module which improves the searching functionality:
* **Select Source:** Allows users to filter search results by data source selection.
* **Filter by Asset Name:** Users can now search by various categories including Source, Collection, Dataset, Columns, Dashboard, Chart, and Data Job.
* Fixed issue where disabled sources were showing up allowing to be linked.
## 23 July 2024
**Config-Configure Monitors**
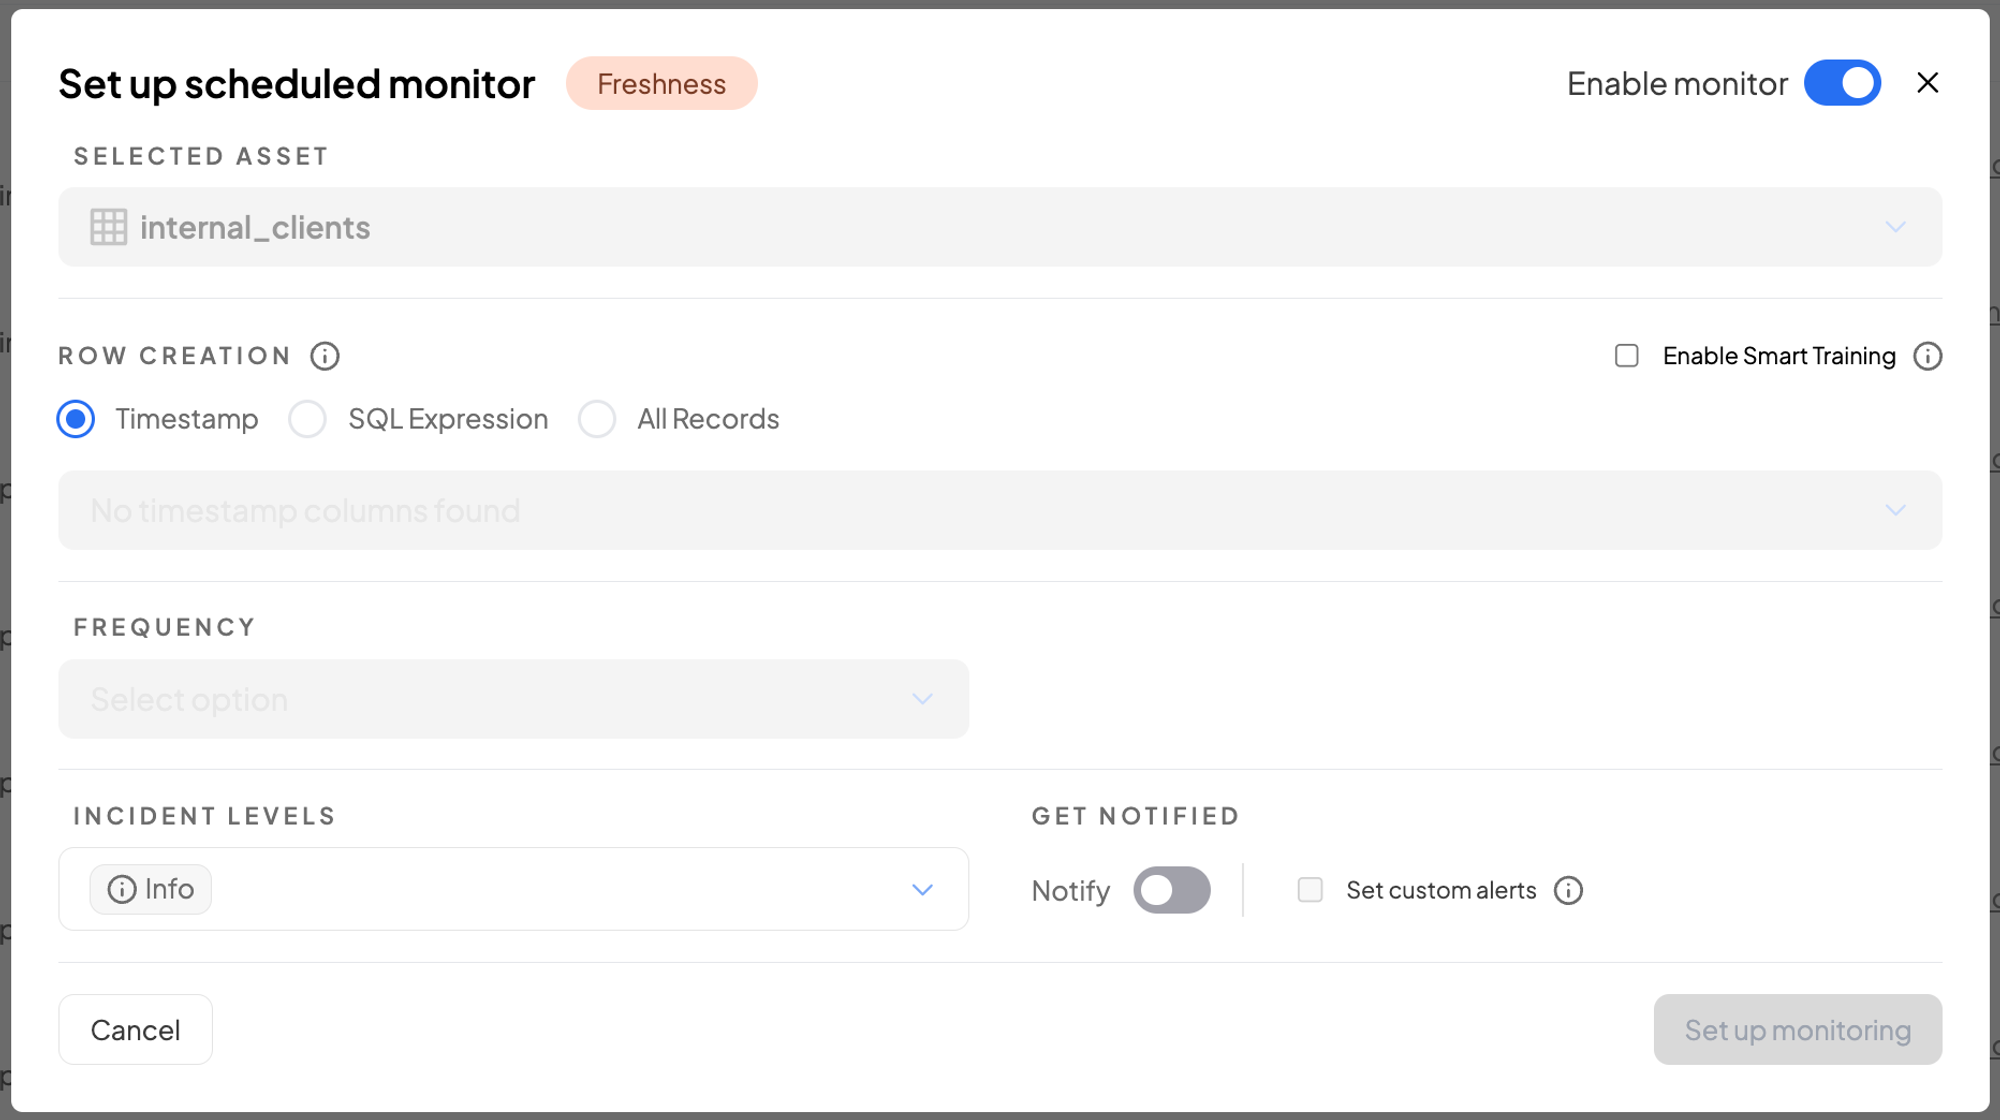
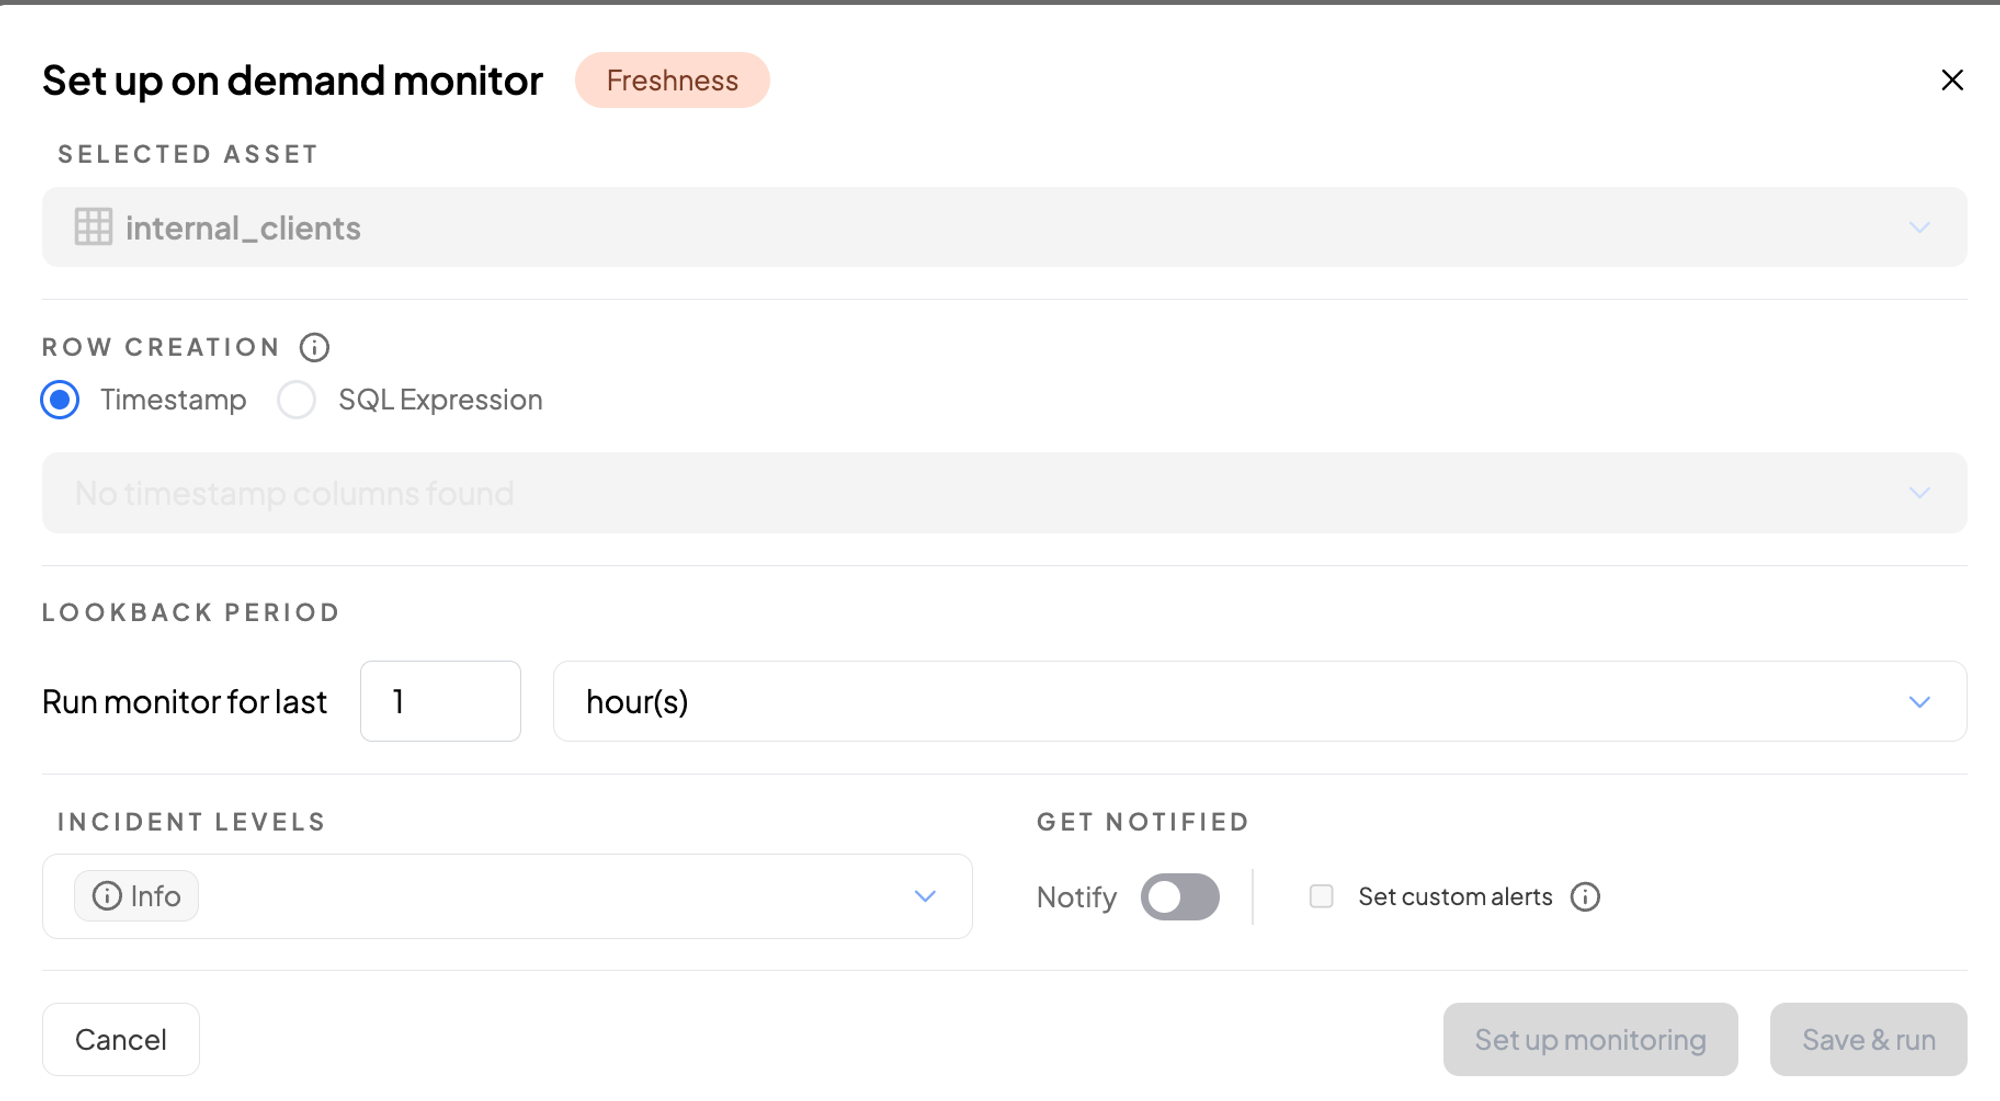
* UX is improved for setting up scheduled and on demand monitors. Incorrect user inputs (eg. thresholds) and required fields are now more clearly shown to inform users on which fields need to be filled before submitting the monitor configuration.
Overview for updated Set up scheduled monitor form
Overview for updated Set up on demand monitor form
* **Custom SQL:** Under Custom Sql monitor, the character limit for the custom SQL monitor name is been increased to 100.
**Catalog-Asset Details**
* **Asset details monitors:** When clicking on configure monitors, user will be directed to the create/modify form for the monitor directly.
* **Export csv:** Now user can export the details of the table (description, tags, classifications) directly by exporting it to csv.
## June 2024
**Dashboard**
* New Dashboard is introduced with Overview, Incidents and Quality tab.
**Overview**
Dashboard provides an overview of:
* **Recently Accessed Assets:** Shows you the recent accessed assets from your dashboard.
* **Top Popular Assets:** Shows the recent activity of assets you have access to, including new data products, updates to the glossaries and others.
* **Recent Activity:** Shows the recent activity of assets you have access to, including new data products, updates to the glossaries and others.
* **Recent Requests:** Shows all access or change requests that have been raised for the assets you have ownership of.
**Incidents**
Under Incidents tab you get analytical incident overview with view of key incident metrics and summaries across domains and data sources.
* **All Incidents:** Shows the total no. of incidents in your organization data with the incidents status percentage for Open, Muted and Close.
* **Incidents Assigned:** Shows no. of Incidents assigned vs assigned.
* **Incident Levels:** Provides breakdown of all incident levels (Info, Warning and Critical).
* **Data Job Statuses:** Provides the data job status percentage (Pass, Fail and Others).
* **Data Contracts Breached:** Shows total no. of data contracts breached on data assets over a time period.
* **Average time to close incidents:** Shows total time required to close incidents shown across a time period.
Also provides a count of **total incidents** that had taken place over your selected timeframe. This information is also further classified into four types of data quality incidents:
* **Volume:** Triggers when there is a significant change in the size of data ingestion.
* **Freshness:** Triggers when a significant time has passed since the last update on the data.
* **Schema Drift:** Triggers when there is a schema change.
* **Field Health:** Triggers when anomalies are detected by our monitors based on the metrics configured by you. You can set up the monitors to track Field Health in the [Data Catalog](https://docs.decube.io/catalog/data-catalog).
* **Custom SQL**: Triggers when anomalies are detected by running the custom SQL.
* **Job Failure:** Triggers when anomalies are detected by data transformation, our system offers specialized Data Job/Job Failure monitors.
**Source/Domain Summary**
The Source/Domain Summary section provides a comprehensive view of all data quality incidents reported within a specified timeframe. Each source/domain will show the following metrics:
* **Tables With Incidents/ All Tables:** Shows the total no. of tables with incidents out of total tables.
* **Incident Count:** Shows the total incident count from assets in the data source.
* **Assigned:** Shows how many incidents have an assignee.
* **Closed:** Shows how many incidents with closed status.
* **Freshness:** This is the number of Freshness incidents.
* **Volume:** This is the number of Volume incidents.
**Quality**
The Quality tab provides a detailed view of data quality across various dimensions, supported by different test types. Here’s what you can expect:
**Quality Dimensions and Test Types**
Our platform currently supports four quality dimensions, each associated with specific test types:
* **Accuracy:** Measures how close the data values are to the true values. Tests include “Regex” and “Value in.”
* **Completeness:** Measures the extent to which all required data elements are present. Tests include “Not Null.”
* **Uniqueness:** Checks each data record to ensure it is unique within the dataset. Tests include “Is Unique.”
* **Validity:** Ensures data conforms to acceptable standards, such as ranges and formats. Tests include “Is Email” and “Is UUID.”
**Source/Domain Summary**
The Source/Domain Summary in the Quality tab provides results based on selected domains and shows scores for seven key quality metrics. This helps you gain a deeper understanding of your data’s health across different data sources and domains, making it easier to pinpoint areas for improvement.
## 21 March 2024
**Release 1.9.6 Updates**
**Linked Glossary/Business terms Column on Asset Details > Schema Tab:**
* Within the Asset Details > Schema tab, a new column titled "Linked Assets" has been added.
* Users can now easily see the linked glossary/business term associated with the asset.
* By selecting the linked term pill, users are directed straight to the corresponding glossary/business term, providing quick access to related information.
**Config Settings - Slack Notification configuration enhancement.**
* User are able to set up config settings just by submitting their Slack Channel ID or Slack channel name.
**Custom SQL - Grouped-by option is now supported !**
* This feature empowers users to organize their custom SQL queries by grouping desired columns and selecting distinct values according to their specific requirements.
## 22 February 2024
***Documentation***
Introducing our Documentation Feature, this feature allows users to add a knowledge base to an asset. Users can add notes directly to each data asset under asset details, facilitating seamless collaboration, knowledge sharing, and troubleshooting.
***Custom Frequency***
Our new Custom Frequency Option gives you complete control over how often your data is monitored. users are now allowed to set custom frequency based on the following frequencies:
* Daily: Users can select any hour of the day and a preferred time zone.
* Weekly: Users can select a day of the week, along with a preferable time zone and time.
* Monthly: Users can select between a monitor running on the last day of every month, or on a specified day of their choice, along with a time and time zone.
Simply select your frequency, set your credentials, and enjoy personalized data monitoring that fits your needs perfectly.
***Model Feedback***
Introducing our Model Feedback update, a user-friendly feature designed to fine-tune the level of sensitivity when providing feedback on incidents within your data monitoring platform. This tool helps users indicate how serious or urgent an incident is, making it easier for administrators to prioritize and respond accurately.
* **Adjustable Sensitivity Slider:** Upon rating an incident as "bad", using the thumbs down icon, users can easily slide the sensitivity scale to indicate the severity or urgency of the incident they're reporting.
***On-Demand Monitoring***
Welcome to our On-Demand Monitoring System, where you get instant insights into your data infrastructure whenever you need them. Here are the monitors that offer On-Demand Monitoring:
* Freshness
* Volume
* Custom SQL
* Field Health (except cardinality)
This feature allows users to create monitors to meet specific, one-off requirements.
## 29 January 2024
***What's New: Microsoft Teams Integration***
We are excited to announce the deployment of our latest update, introducing seamless integration with Microsoft Teams. Users can now utilise Microsoft Teams as their primary alerts medium and effortlessly configure custom alerts for their monitors through Decube.
**Key Features:**
* **Microsoft Teams Alerts:** Users can now choose Microsoft Teams as their preferred channel to receive alerts, enhancing real-time communication within teams. This can be configured at 'Config Alerts' under 'Config Settings' tab.
* **Custom Alert Configuration:** Tailor alerts for your configured monitors according to your specific monitor configuration needs.
## 18 January 2024
#### What's New
**Release 1.8.0 New Features:**
**Enhanced Asset Management:**
* Simplify permissions with the new "Request Access" feature, enabling users to conveniently request and grant permissions directly through the Catalog. This streamlined process ensures precise access for designated individuals.
* Designate ownership for connected data sources, bringing clarity and accountability to your system. Now, it's clear who is responsible for each connected data source.
* Flexibility in ownership extends to data sources, allowing seamless adaptation and reassignment of responsibilities within teams, fostering improved collaboration and resource management.
* Empower your teams with the ability to transfer ownership of schema and table assets, providing greater flexibility in adapting and reallocating asset responsibilities.
**Catalog Module Improvements:**
* Experience a more streamlined user interface with Catalog module enhancements, now including Schema assets and Data source assets. This update offers a comprehensive overview of tables within a schema and data sources, with the added ability to explore individual levels of selected data source assets.
**Asset Overview Update:**
* The updated Asset Overview in the Schemas and Data Sources catalog provides a more comprehensive summary for your schemas and data sources, including `counts of schemas`, `schemas without owners`, `total incidents`, `incident percentage`, `number of tables`, and `tables with incidents`.
**Access Request Management:**
* Enhance communication and streamline access requests with our updated "Request" tab within the Catalog module. Reviewers/Data Source/Schema/Data Source owners now receive a "Request Access" email, facilitating efficient management of access requests.
**Centralised Permissions Overview:**
* Simplify user access management with the centralized permissions overview in User Info and Group Management. Access a comprehensive overview of granted permissions on table level/group level requests, making the process more user-friendly.
**Lineage Revamp:**
* Explore our revamped Lineage feature, offering a dynamic and user-friendly interface to showcase your data flow. Experience dynamic upstream/downstream relationship lines and efficient column-level search functionality within the lineage table.
#### **Bug Fixes**
* Patched issues with the Redshift Connector Form.
* Patched issues with the Power BI Connector Form.