> For the complete documentation index, see [llms.txt](https://docs.decube.io/llms.txt). Markdown versions of documentation pages are available by appending `.md` to page URLs; this page is available as [Markdown](https://docs.decube.io/data-quality/how-to-set-up-monitors/set-up-grouped-by-monitors.md).
# Grouped-by Monitors
This document provides conceptual information for leveraging the Grouped By option in your data quality workflows.
By utilizing Group By monitors, data teams have the ability to highlight and define specific segments within a table, like those aggregated by values in a dimension column. Following this segmentation, monitors can be applied. This functionality enables teams to not only track the overall row count of a table but also monitor counts of its individual logical subdivisions.
The configuration process for Grouped-by monitors differs from the setup routine of other monitor types, here's how you begin setting up for Grouped-by monitors.
### Setting Up Grouped-by monitoring
For initial steps you can refer to below links:
* [Set Up Freshness Monitors](/data-quality/how-to-set-up-monitors/set-up-freshness-monitors.md)
* [Set Up Volume Monitors](/data-quality/how-to-set-up-monitors/set-up-volume-monitors.md)
* [Set Up Custom SQL Monitors](/data-quality/how-to-set-up-monitors/custom-sql-monitors.md)
* [Set Up Field Health monitors](/data-quality/how-to-set-up-monitors/set-up-field-tests.md)
To configure Grouped-by monitors in Field Health follow below steps:
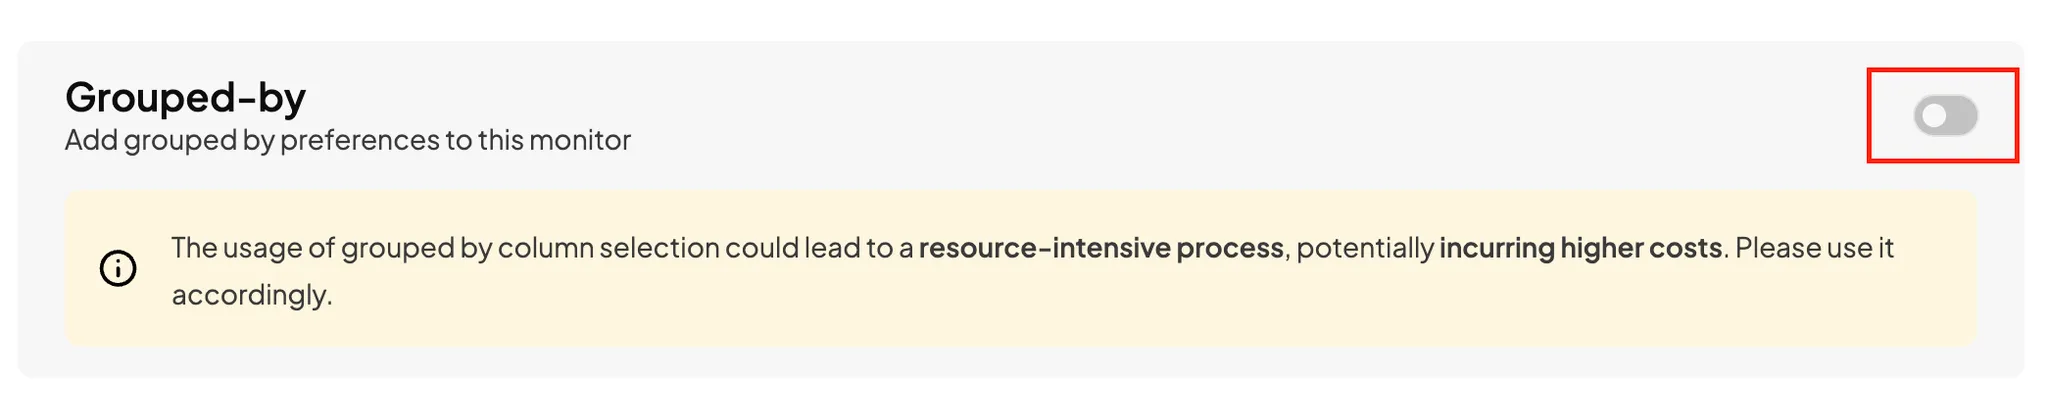
* **Enable “Grouped By” (if applicable)** by toggling the switch.
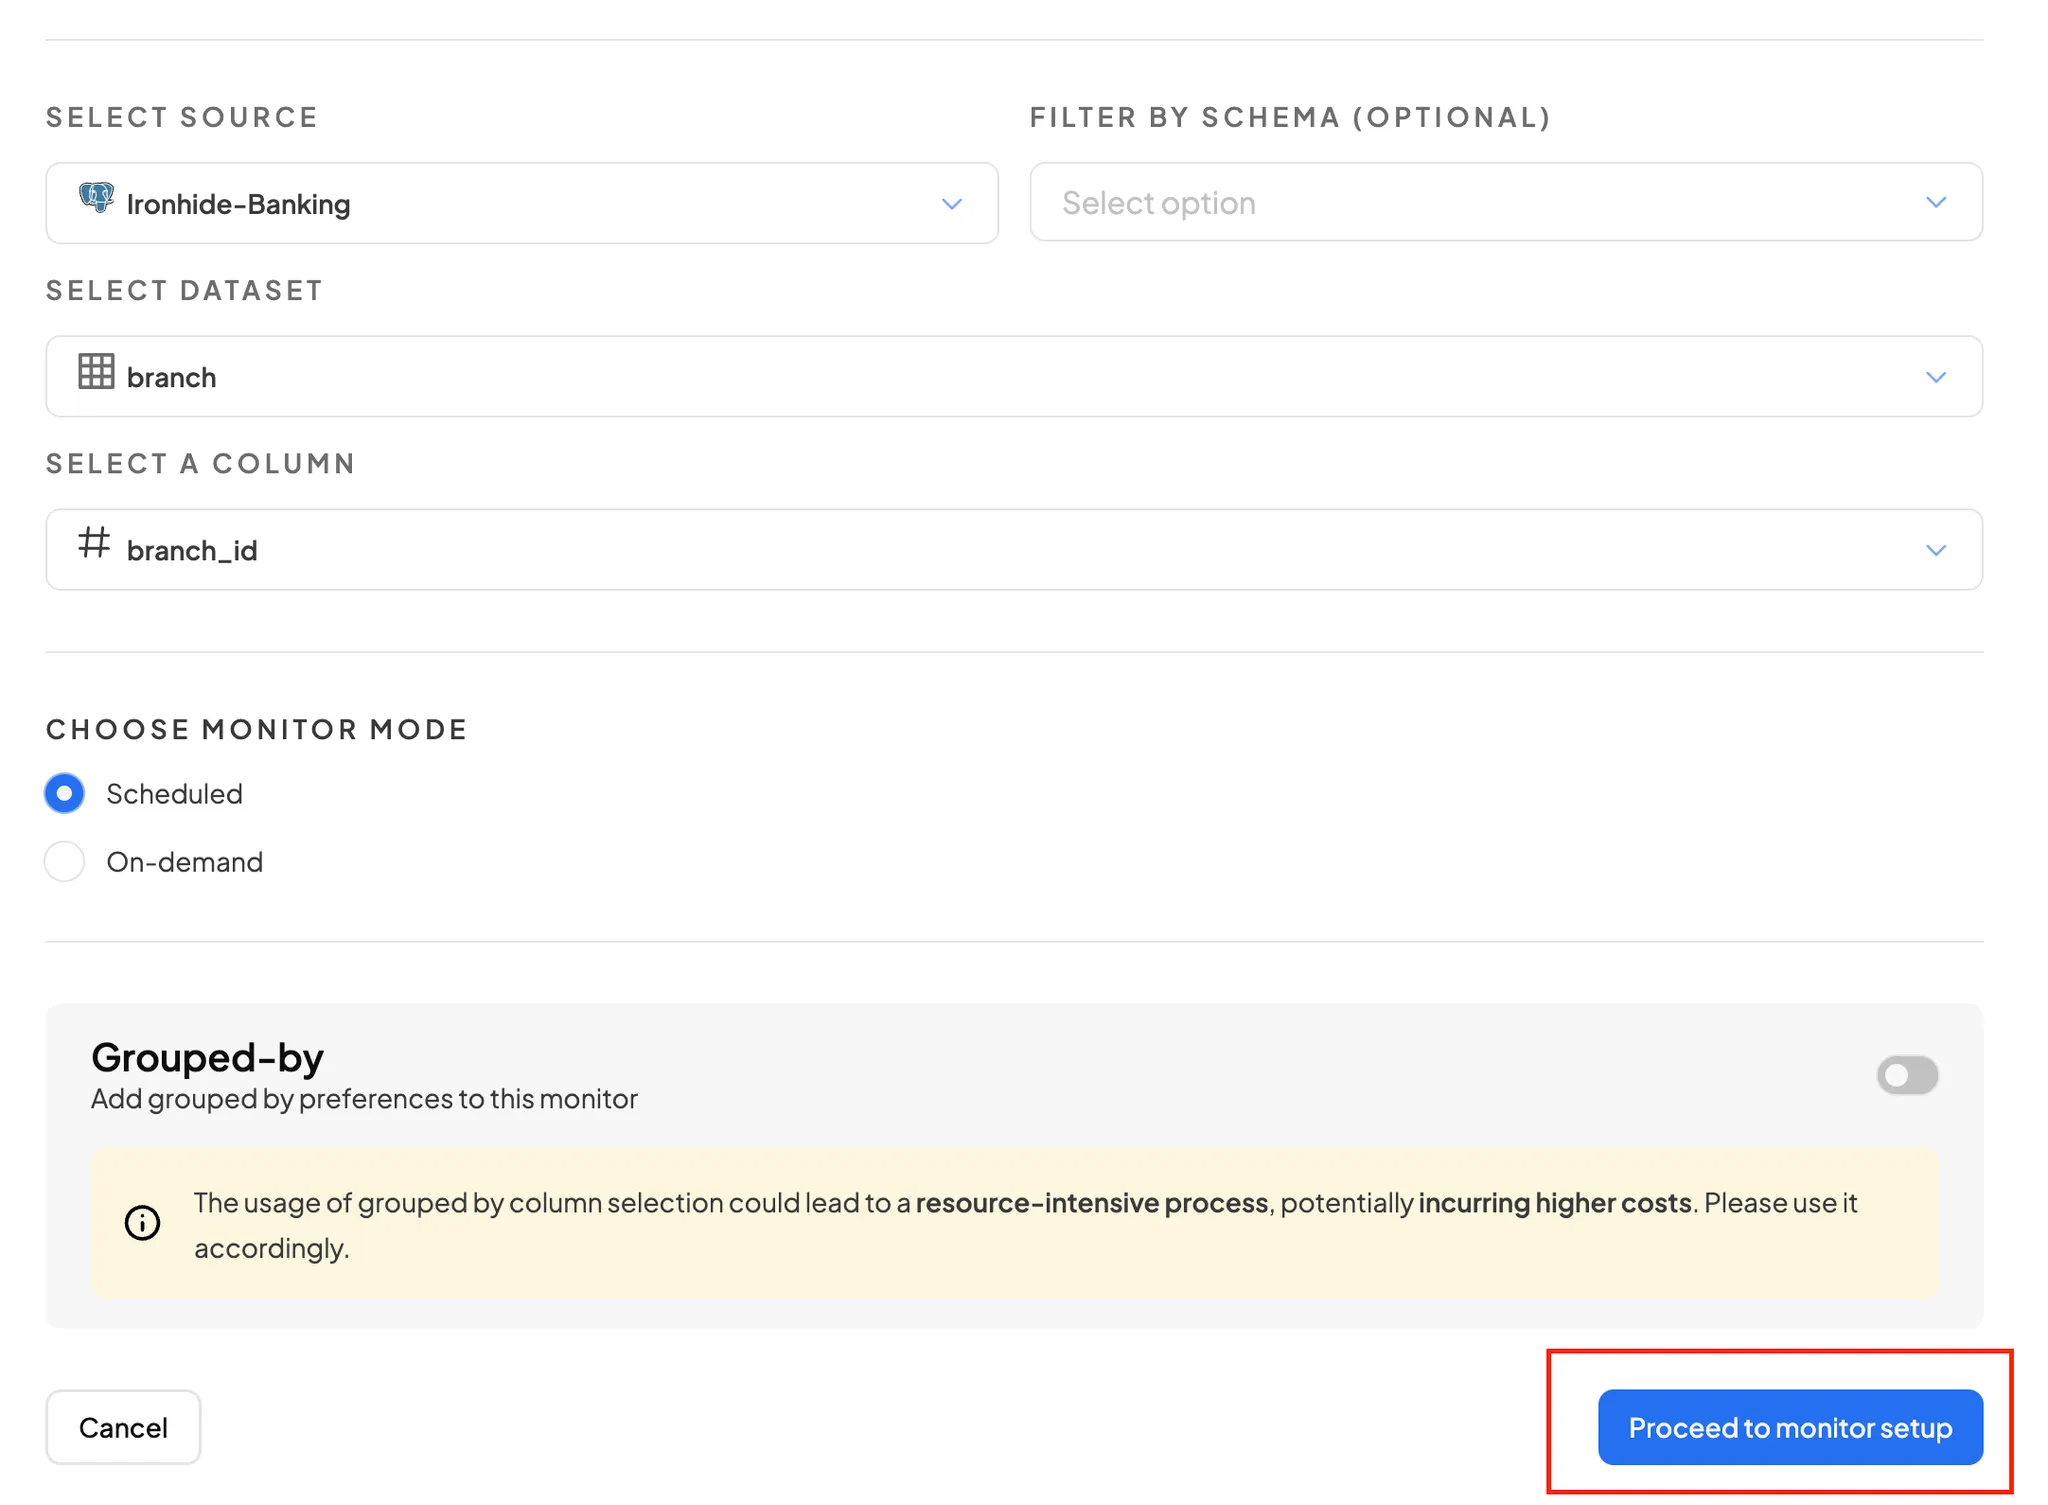
* Select the column for grouping and click **Validate**.
* A success message (**“Column is valid to be grouped by”**) confirms validation.
Grouped-by diabled
Grouped-by enabled
* Click **“Proceed to Monitor Setup”** to move to the next step.
Setting-up monitor grouped-by disabled
### Configure: On-demand /Schedule Monitor Grouped By for Custom SQL
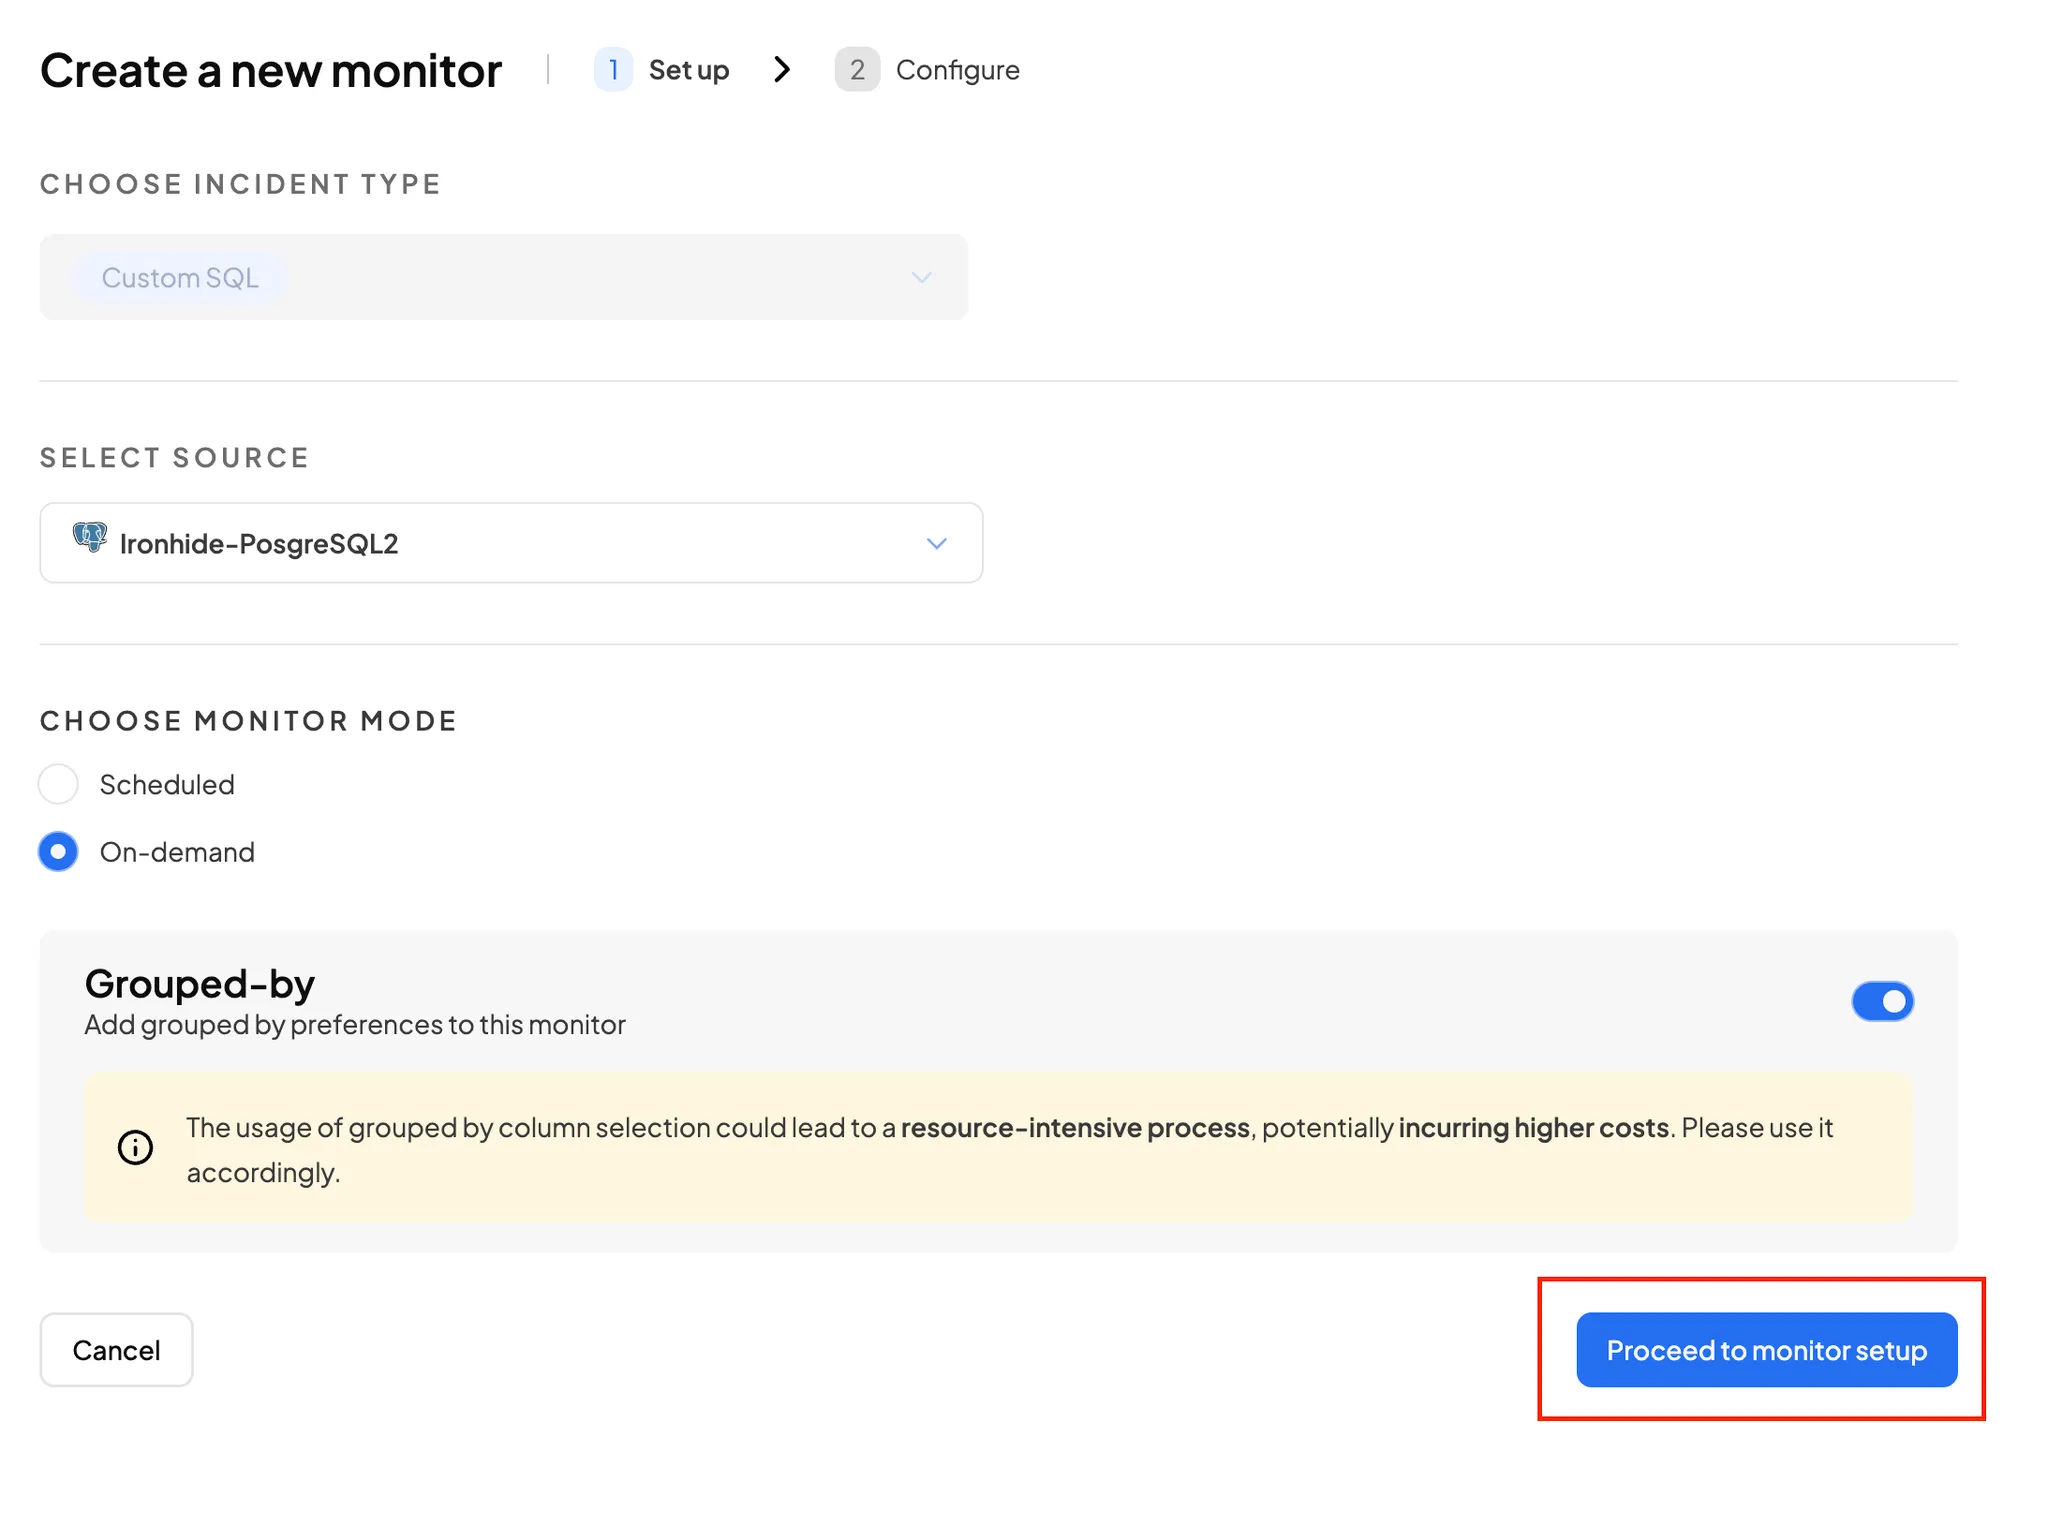
* Once you select On-demand/Schedule as monitor mode, next step is click on `Proceed to monitor setup` button.
Grouped-by enabled
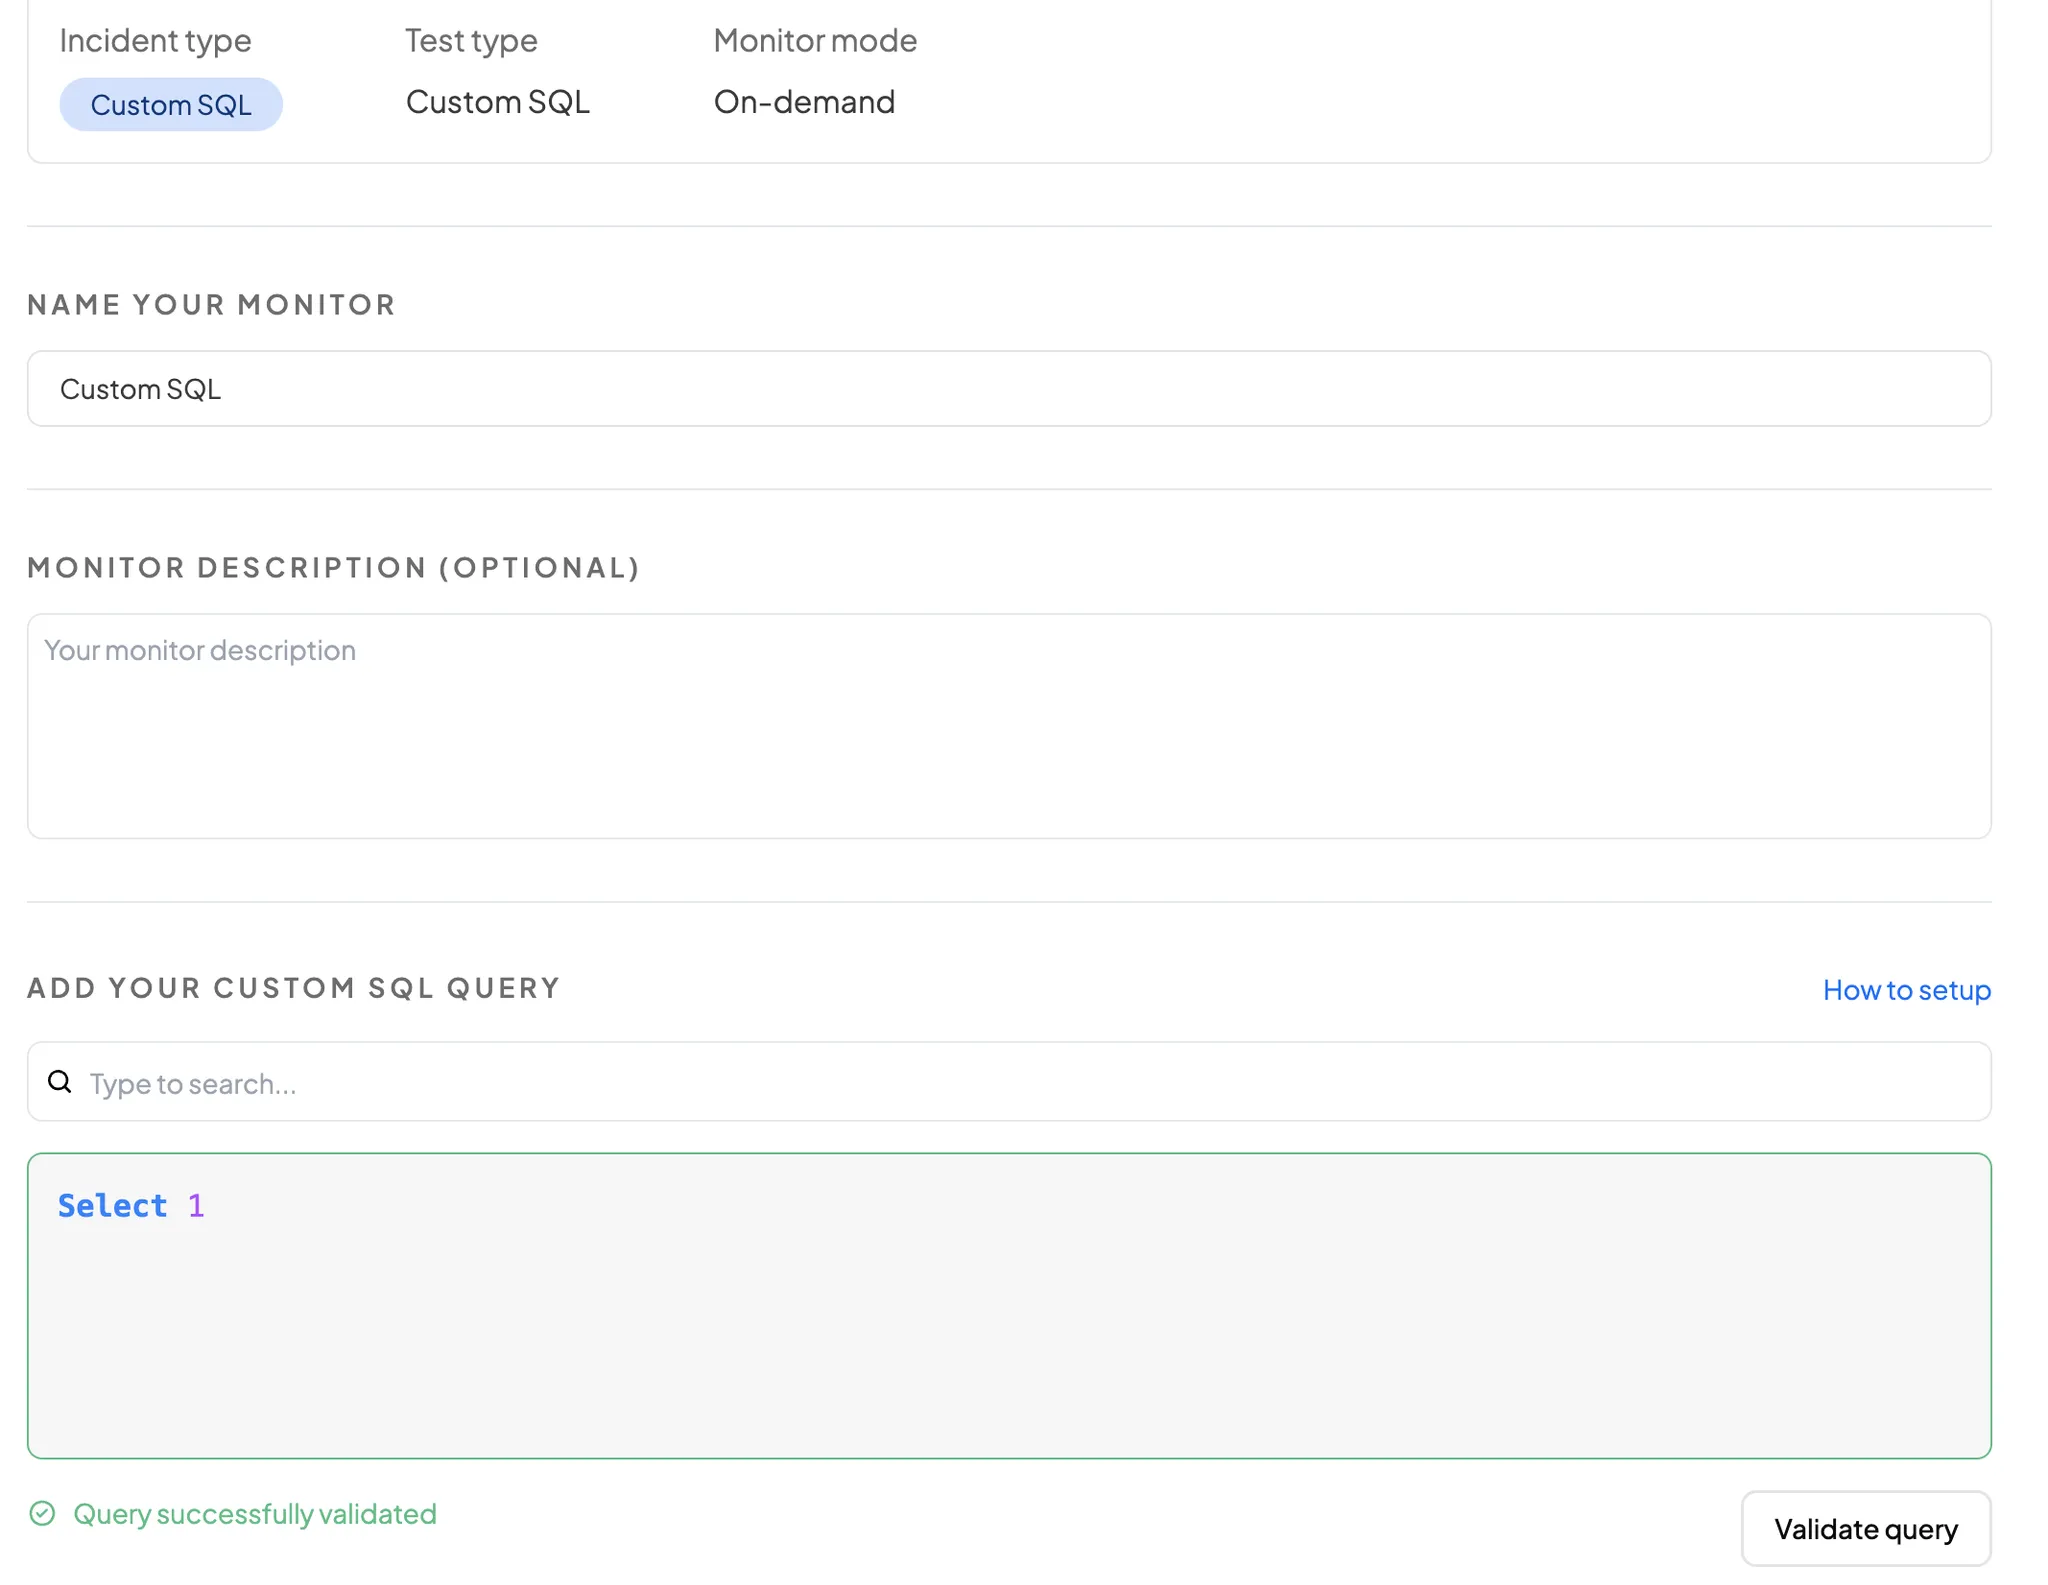
* Once you click on `Proceed to monitor setup` button, you will reach the next page (Configure).
Overview for SQL Query validation
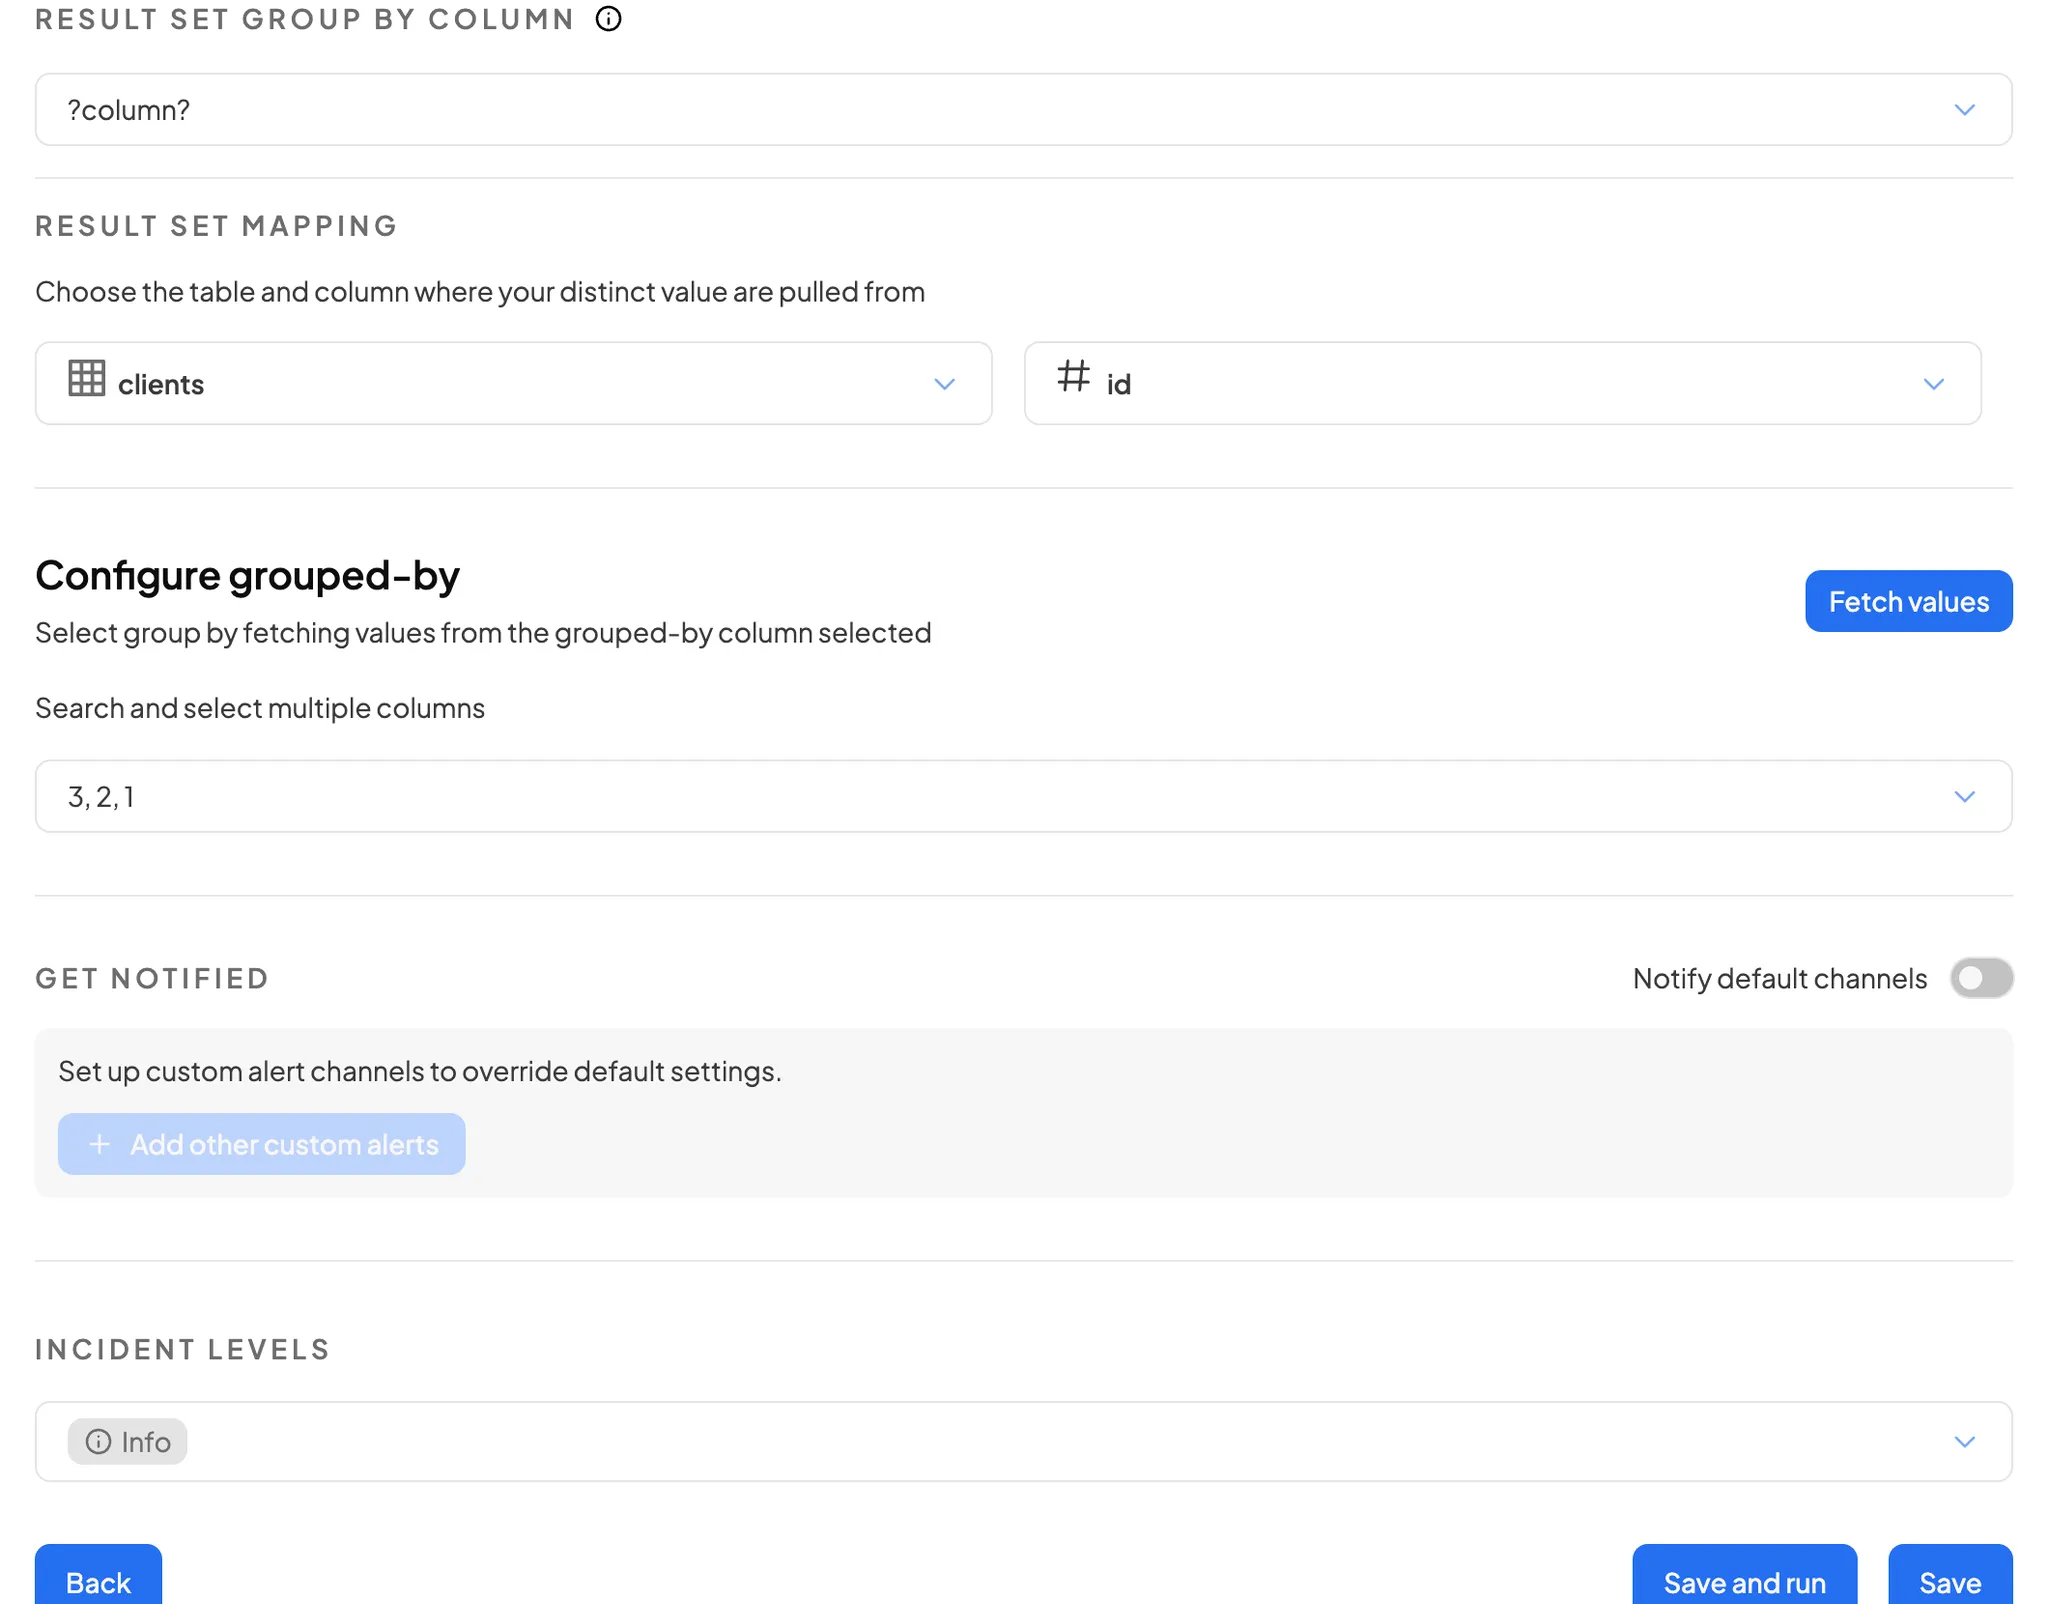
* **Result Set Group by column:** Select from dropdown, This is the column from your query result above that contains the value to group by.
* **Result Set Mapping:** Choose the table and column where your distinct value are pulled from.
***
### Configure Grouped-by (Other Tests)
{% hint style="info" %}
Note that if the distinct values in your selected column exceeds more than 100, you will not be able to add that as a group-by column. Please reach out to us if support is required on this.
{% endhint %}
* **Fetch Values:** Click on Fetch Values button and Select group by fetching values from the grouped-by column selected
* **Search and select multiple columns:** Select from dropdown